Donald Trumps usage of Twitter especially following his election in 2016 was only one illustration of the Left-Right political cleavage in the United States of America. The political cleavage can be defined as the cultural and ideological “gap” that divides groups of differing political interest. Leveraging the Quotebank dataset, a dataset of quotes extracted from news articles, we propose to measure the evolution of this cleavage across time, and especially focus on how major elections i.e. the presidential election or midterms affect the cleavage short-term between January 2015 and April 2020. We’re expecting this cleavage to increase, specially around events such as the presidential election or some specific events like the outbreak of the corona epidemic (2020), major mass shootings, the first impeachment of Trump (2019), or the riot in Charlottesville (2017). We are not looking at events from the later half of 2020, and hence, the January 6th riot (2021), Joe Bidens election (2020), and him subsequently taking office (2021) are omitted.
For this analysis, we propose to measure the cleavage through a sentiment score extracted over the quotes from contemporary political members of the republican and democratic parties targeting members of the other party. The extracted scores range from -1 (very negative) to +1 (very positive).
Overall look
Now, let’s get our hands dirty! What are we facing? Here are a few statistics on the dataset we’ll analyze:
- More than 100k quotes said by 776 unique US politicians
- From them, democrats were quoted 49k times, and republicans 56k
- Wow! Republicans seem to talk a lot. Really? Trump was quoted… 23k times
- The next most quoted speaker is Hillary Clinton with more than 4.5k quotes
- The overall sentiment score is 0.047
- Democrats seem to be a bit more positive with an average score of 0.049, while republicans have an average score of 0.044 - and the values are significantly different at the 10 % level
- The most positive quote is attributed to… Elizabeth Warren (Dem.)
- And the most negative to… Kevin McCarthy (Rep.)
Let’s now look at the overall evolution of the sentiment’s score for both parties.
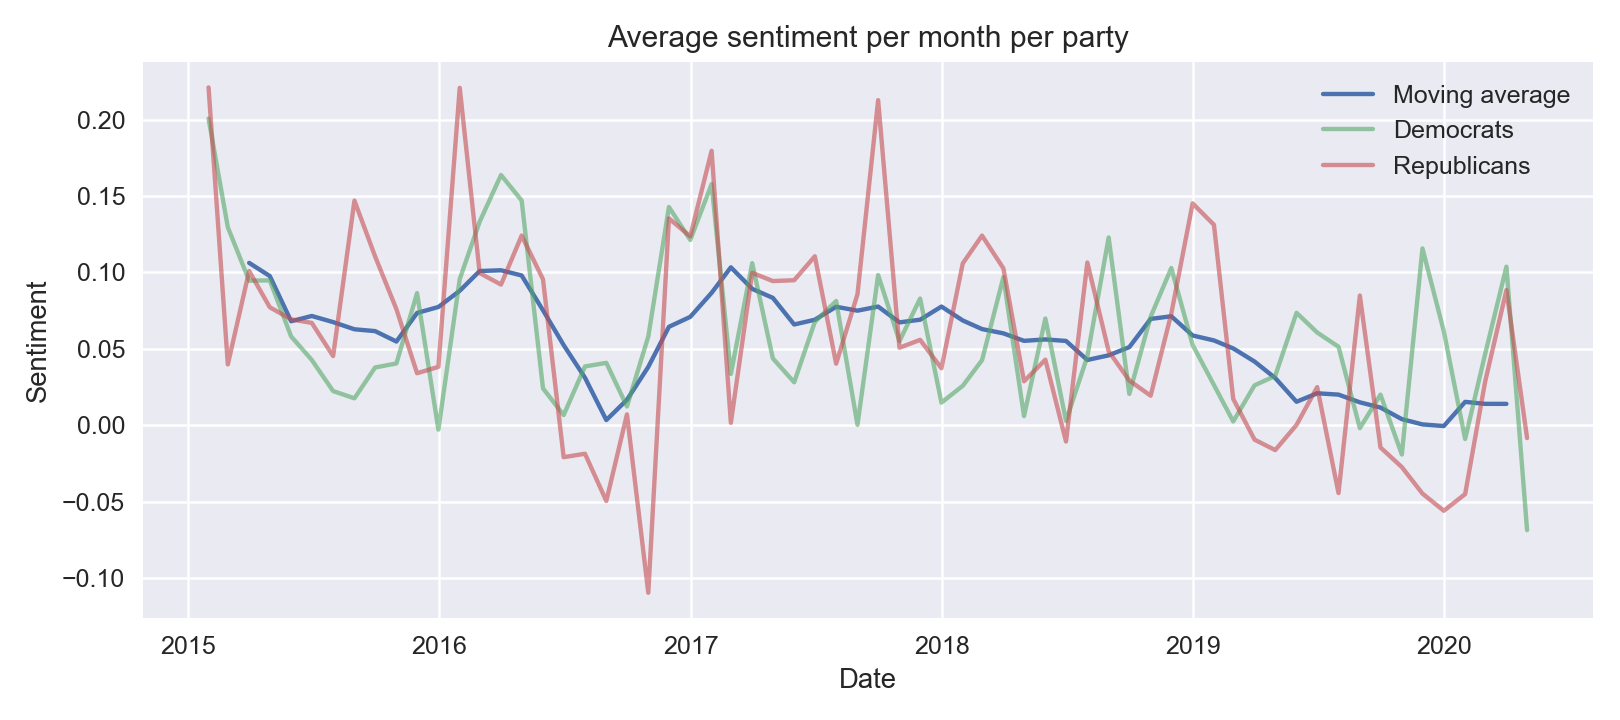
This graph is very interesting. While it seems quite hard to draw insights when first looking at it, we can still make some observations. First, the average sentiment score is decreasing for both parties since 2017. Second, it seems that in some cases, both parties have a similar score on a given month (see beginning of 2017). However, in some cases like at the end of 2015, in the middle of 2017 or just at the end of 2019, both parties are strongly opposed. Could it be that this is the consequence of some events?
Those are all hypothesizes and questions that we’ll try to answer. Before that, since we are analyzing the sentiment of each quote, we will first take a look at the semantic side of the analysis.
Most common words used
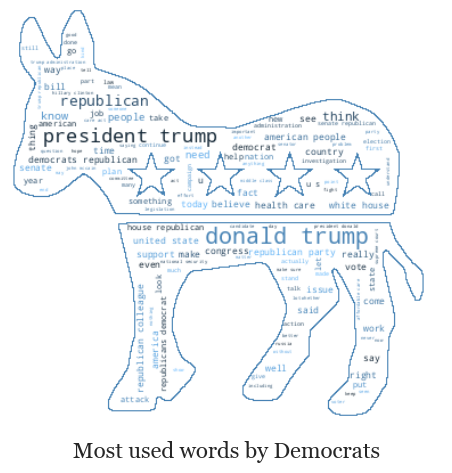
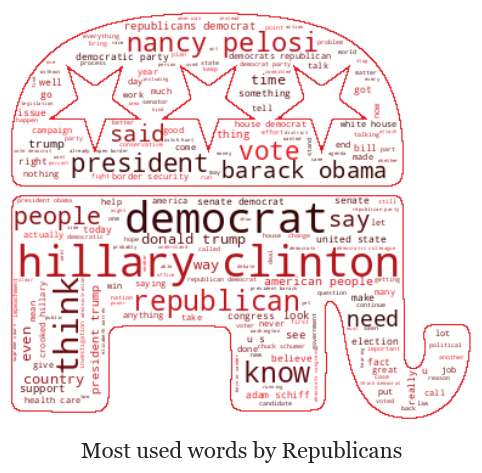
Unsurpisingly, we see that democrats’ most used words are targeting Donald Trump while republicans seem to focus on Hillary Clinton, Barack Obama and Nancy Pelosi. Apart from that, we see other interesting recurring words from both democrats and republicans like “health care”, “right”, “vote” and “fact”. The main difference between the parties seem to be when politicians are directly mentioning someone. Remember, those are the most used terms when mentioning republicans. This underlines the main topics.
In light of what we just saw, let’s now explore the different topics said by politicians over the years.
Who speaks about what?
In this part, we propose to analyze the sentiment of the most trending topics from the perspective of both parties through time. This allows us to see how common topics provoke different reactions and how the attitude towards certain topics may vary over time.
In order to do that, we use a topic detection technique called Latent Dirichlet Allocation (LDA) which is an unsupervised machine learning method that classifies our quotes represented as bag-of-words into particular categories. As an output, we receive the most common terms for each topic and the distribution over the topics for each quote. For every year, we classified the quotes into 3 main topics for both political parties and found that through time, depending on the political affiliation, trending topics may change. One of the most recurrent topic over time, particularly in 2015, 2016, 2017, 2019 and 2020, for both, republicans and democrats, were presidential elections. However, the words representing the topic of presidential elections varies over time.
For example, for democrats in 2015, the words that represented the election’s topic were mostly about primary elections and potential republican candidates such as Donald Trump, Marco Rubio, Paul Ryan, Jeb Bush. For republicans, the topic of elections in 2015 was also containing terms about potential democratic candidates for the first round of presidential elections: Hillary Clinton, Elizabeth Warren, an interesting bigram (pair of words) from the most common terms was beat Hillary. We notice as well, that Donald Trump for democrats and Hillary Clinton for republicans, were already considered as the biggest opponents as their names lead in the number of occurences in the topic of elections in 2015.
In 2016, the election’s topic mostly focuses on the second round of elections. For democrats, the main focus is on Hillary Clinton as she is the candidate with the most potential to win the elections, also Bernie Sanders receives some attention from his fellow party. The democrats mention a lot Donald Trump in the topic of elections as he is already considered as the main opponent from the side of the republican party, we notice interesting terms that describe the topic, such as insult, fear, wall. From the republicans side in this year, the focus is on the both opponents from the democratic party: Hillary Clinton) and Bernie Sanders, we nottice intersting bigrams: crooked Hillary, lie. After the official results of the second round of elections and the winning of Donald Trump in late 2016, we then in 2017 notice that the focus on the election’s topic for democrats is mainly on president Trump. Some words that occur often in the topic are investigation, security, Russia. For the republicans, a.k.a the winners, the most common words are lose election, win, Russia.
The year 2018 doesn’t generate the topic of elections as one of the most common ones, however in 2019 the talks about elections again become popular and we see that democrats are preparing for them as they use words like: win, beat Donald, climate, racist in the context of elections. Republicans, from their side, use commonly the following terms: socialist, left, witch hunt.
Starting the year 2020, the democrats use commonly bigrams like defeat Donald or beat Donald when they discuss the presidential race. The republicans focus on the primary elections and mention potential candidates: Bernie Sanders, Elizabeth Warren and Joe Biden. The extracted words clearly show, that at least during election periods, the right and the left are opposed and the cleavage is increasing.
As our dataset contains quotes about the presidential elections of 2016 and 2020, to visualize the evolution of the sentiment towards this topic, we produce 2 time series plots in which we represent the sentiment towards presidential elections of 2016 and the sentiment towards presidential election of 2020.
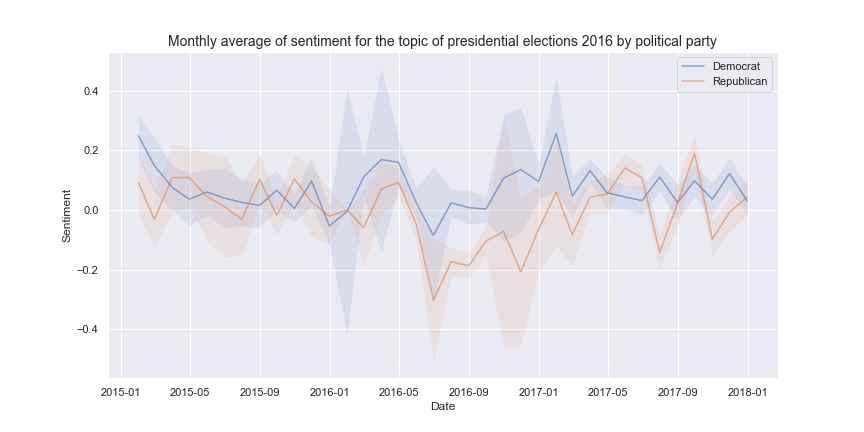
On the graph representing the sentiment towards presidential elections in 2016, both parties seem to follow a similar behavior. However, we notice that in 2016, espacially as we get closer to the election, the sentiment related to the elections towards the opponent party decreases a lot. The decrease seems to be especially high for the republicans.
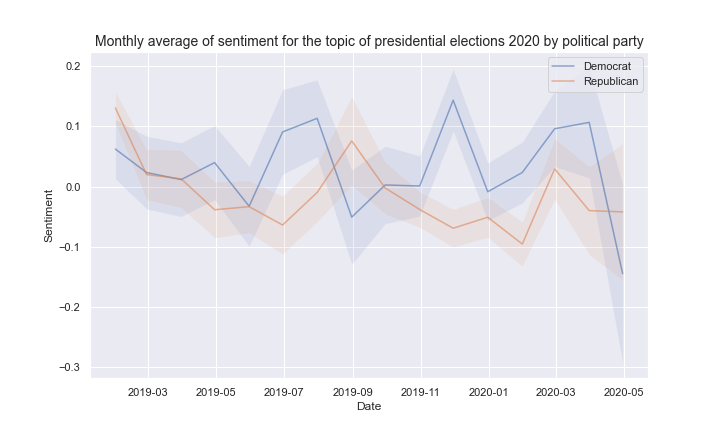
The second graph, the sentiment towards presidential elections in 2020, follows a similar behavior for both parties but as before, we notice that republicans tend to have a sligthly lower sentiment most of the time. Also, we may suppose that we are in presence of a negative trend, because the closer we get to the elections date, the lower the sentiment seems to be for both parties. But can we say that there really is a trend?
Any trend?
We now want to know if there is a trend, if yes how it is in general, how it is across parties, and how dark the future is.
One of the simplest models to estimate and interpret is the linear y = ax + b model where x is the time and y is the sentiment score. Using this on the sentiment scores where we set x as the time in days from the first quote in the data we then get:
- All: sentiment score ~ -3.364e-5 * x + 0.0850
- Republicans: sentiment score ~ -4.695e-5 * x + 0.0986
- Democrats: sentiment score ~ -1.800e-5 * x + 0.0697
I.e. the sentiment score decreases on average by 1.23e-2, 1.71e-2, and 6.57e-3 every 365 days (roughly one year) for all, republicans and democrats respectively.
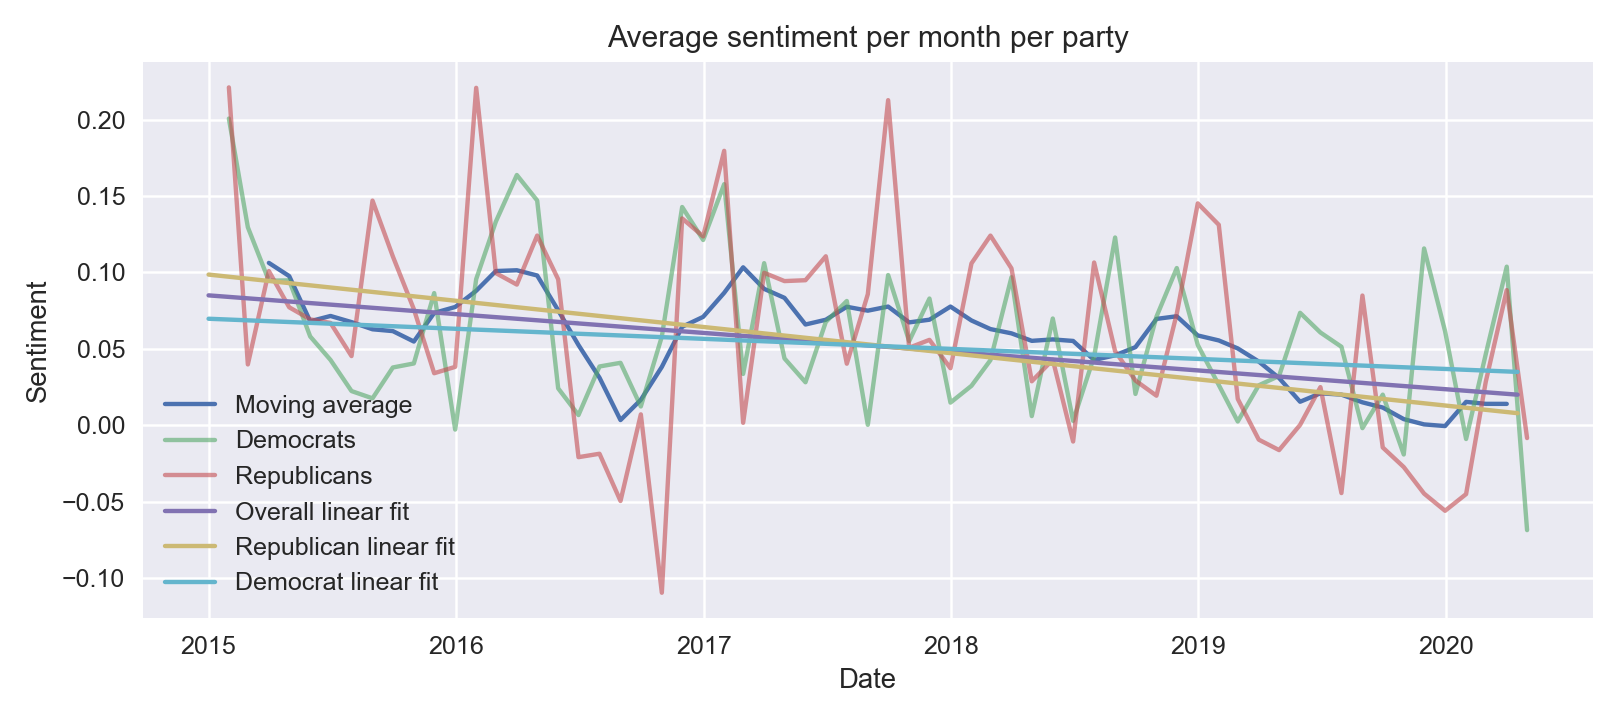
So it seems like, even though the republicans start out being less aggressive than their opponents, they tend towards being more aggressive, to a point where they would end up be more aggressive by the end of 2017. However, the overall trend is also negative and democrats are not saints - they may not be trending downwards as fast as the the republicans, but they are also becoming more aggressive… But maybe this is not as bleak as we first could assume. The model coefficients may all be significant, but the models fits the data poorly and hardly explain any of the variation in the data (R2 scores around 0.000 to 0.002).
Further analysis shows that an ARMA (2,1) model is able to describe the variation in the data better than the linear model (R2 of 0.13). This implies that in a sense the sentiment is just random variations that will ebb and flow, so maybe we should not be so worried about the future of the political system… but just maybe…
Who is the most aggressive?
We have seen above about the general trend for both parties. But is that trend driven by a few politicians? That’s what we’ll investigate here.
First, we should note that we consider a politician as being aggressive if she or he has at least 100 quotes with an average score of -0.05.
When we look at the whole dataset, we discover that democrats seem to be more aggressive. Indeed, out of 17 aggressive politicians fromn 2015 to 2020, 14 are democrats, that’s more than 80%! Republicans seem to be quite far away from the old grumpy reactionary stereotype that we might have. But does the picture change when we look at it on a yearly basis?
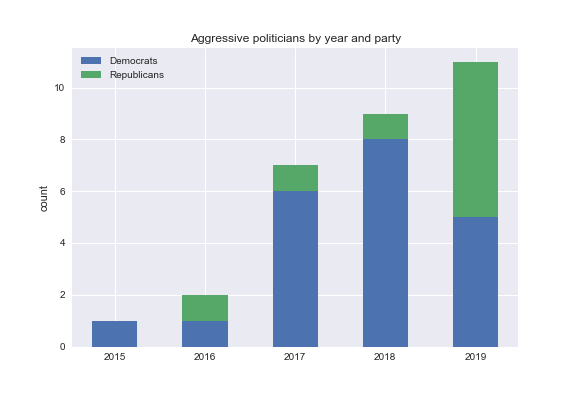
That’s more interesting. In 2017 and 2018, aggressive speakers are overwhelmingly democrats. Only one republican is denoted as aggressive. In 2019, we have an exact parity between democrats and republicans.
From this figure, we clearly see that something seems to have happened around 2016 (Trump’s election?) which seems to have (1) greatly increased the number of quotes about the other camp by politicians and, (2) greatly increased the number of aggressive speakers (democrats in that case). In 2019, republicans seem to have responded to that aggressivity by also being aggressive. In other words, whatever happened in 2016 seems to have increased the political cleavage in the US. This leads us to think that major political events like Trump’s election could have been a driver to increase the political cleavage in the USA. But is that true?
Impact of key events
To see the potential impact of key events on the political cleavage’s evolution, we first need to have a list of major events. For that, we decided to manually gather a list from Wikipedia’s yearly US events. We included any event that we deemed either (very) important on a national or international scale, or that had the potential to increase discursive polarization. For the latter, an example would be one of the many mass shootings that inevitably sparks a debate about gun control between the two political camps.
Remember the plot from the beginning? What happens if we add events to it?
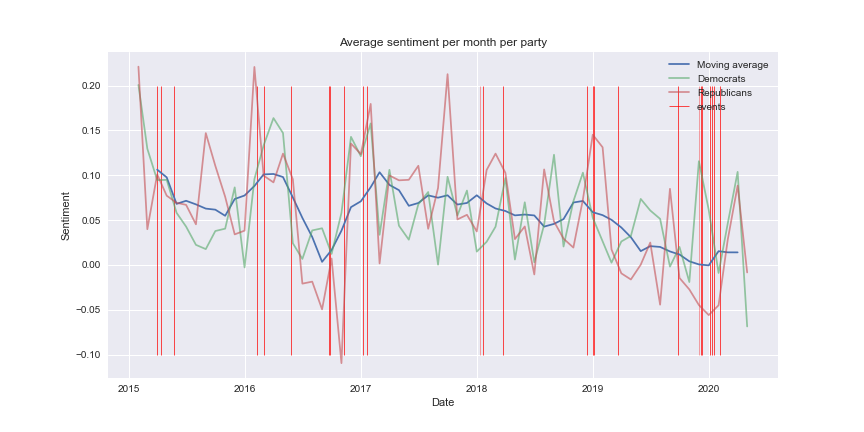
Well, it seems uncertain to see what effect the events have on the sentiment score. If there is one, it is not systematic. To further our analysis, we will focus on each event individually. To do so, we take a look at the evolution of the number of quotes and their sentiment around each key events. We’ve computed metrics on the average score, the number of quotes for each period and party, and the difference between periods. Here’s a graphical representation of these metrics :
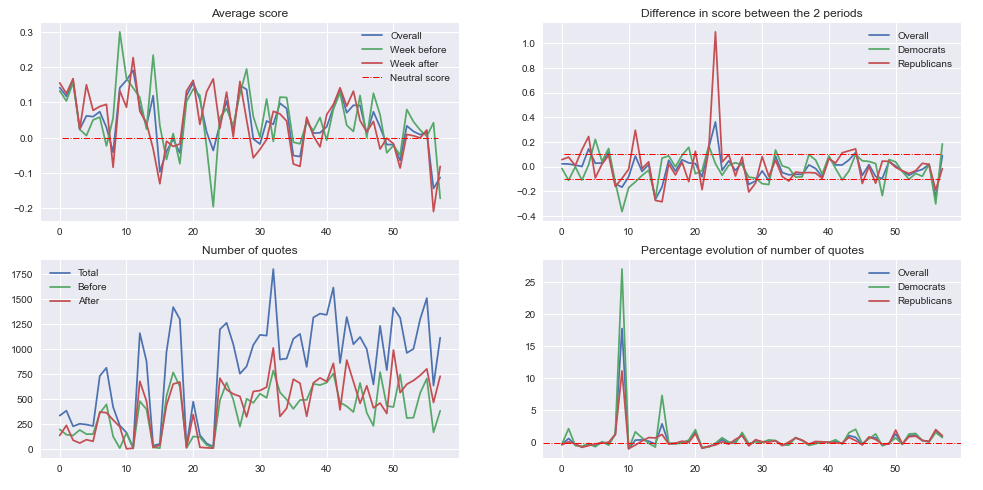
We can see an overall slightly decreasing average sentiment score trend as exhibited earlier. The bottom left plot showcases the number of quotes for each event. We see a very fluctuating behaviour (keeping in mind not all events had the same importance) but we can see either an overall increasing trend or a separation around the 23rd event from where politicians where more talkative. Gaps between the red and green curves could express a causal impact of the event on the talk rate of politics. These gaps seem to be wider from the 23rd event separation point. The percentage evolution of quotes number seem steady around 0 except the 2 big spikes. However, upon closer inspection (where we remove the 2 extreme values), we observe the following plot :
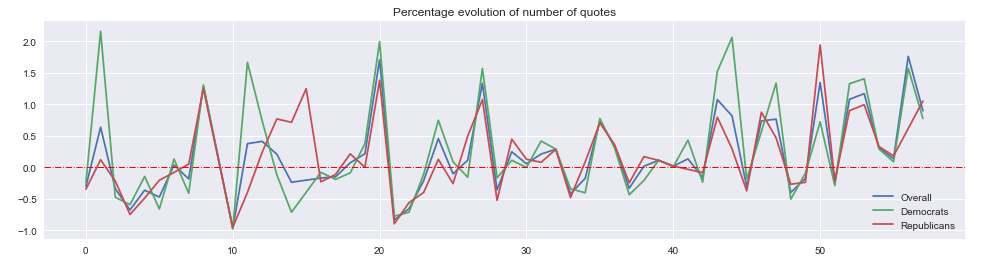
Zooming on the chart we see that, despite the fluctuations of the curves around the 0 line, when it goes above it, the spikes tend to go to a higher order of magnitude. This observation, coupled with the increasing number of quotes show a heavier reaction of politics towards their antagonist. The highest percentage evolution represent the events which influenced politicians the most to call out their opponents. Here’s a table of the 20% top scores for all politics :
| Event | Diff_comp_avg | Quotes_num_bef | Quotes_num_aft | Quotes_num_evol | |
|---|---|---|---|---|---|
| 8 | San Bernardino shooting | -0.13973 | 128 | 293 | 1.289062 |
| 9 | New Hampshire primaries won by D. Trump | -0.166725 | 12 | 225 | 17.75 |
| 15 | Democrat Representatives protest in House of R... | -0.164455 | 11 | 43 | 2.909091 |
| 20 | D. Trump visits Taiwan | 0.024653 | 128 | 347 | 1.710938 |
| 27 | New immigration policy bill by Trump administr... | 0.035392 | 226 | 528 | 1.336283 |
| 43 | Democrats in majority in the House of Represen... | 0.054065 | 429 | 890 | 1.074592 |
| 44 | 2020 presidential campaign starts | 0.113974 | 372 | 676 | 0.817204 |
| 50 | Start of impeachment inquiry against Pres. D. ... | 0.004898 | 422 | 991 | 1.348341 |
| 52 | D. Trump refuses to appear for to his impeachm... | -0.070593 | 312 | 649 | 1.080128 |
| 53 | Allegations of abuse of power from D. Trump | -0.039954 | 316 | 686 | 1.170886 |
| 56 | Murder of Iranian general Qasem Soleimani | -0.251909 | 169 | 467 | 1.763314 |
| 57 | House of Representatives limits Pres. power to... | 0.090469 | 384 | 729 | 0.898438 |
Looking at this table, we see that the events that spark the most debate are on majority of political origin. Upon further inspection, 6 out of the 12 most controversial events are about former president D. Trump. The difference in sentiment score is pretty high after he won the New Hampshire primaries. However, we should note that this score doesn’t reflect the true sentiment as we lack data from democrats before the event.
| Event | Diff_comp_avg | Quotes_num_bef | Quotes_num_aft | Quotes_num_evol | |
|---|---|---|---|---|---|
| 2 | 2016 presidential campaign | 0.01201 | 138 | 91 | -0.34058 |
| 3 | Baltimore protests | 0.000618 | 193 | 62 | -0.678756 |
| 4 | H. Clinton email's controversy | 0.144023 | 151 | 96 | -0.364238 |
| 5 | Same-sex marriage supreme court rule | 0.027039 | 152 | 80 | -0.473684 |
| 10 | Super Tuesday | -0.081974 | 162 | 5 | -0.969136 |
| 21 | US troosp withdraw from Afghanistan | -0.082436 | 122 | 20 | -0.836066 |
| 22 | Allegations of russian interference in preside... | 0.154115 | 44 | 15 | -0.659091 |
| 28 | Las Vegas mass shooting | -0.144179 | 504 | 323 | -0.359127 |
| 33 | Marjory Stoneman Douglas High School shooting | -0.047664 | 568 | 328 | -0.422535 |
| 37 | Trump opposed to russian interference investig... | 0.013622 | 493 | 329 | -0.332657 |
| 45 | Huawei accused of fraud | -0.071283 | 662 | 458 | -0.308157 |
| 48 | El Paso shooting | -0.096658 | 770 | 461 | -0.401299 |
This table shows the other side of the previous table, where we present the events that induced the most silencing effect on politicians. The recurring themes are mass shootings and topics where politicans have to take a stance that can be cleaving for the electors: Same-sex marriage supreme court rule, Baltimore protests, LGBT debate for republicans.
All in all, this event examination revealed some pretty expected results. Overall, the amount of reaction has increased over time, with reactions being more virulent on political topics that don’t force politicians to take a stance (touchy subjects) or following mass shootings. Donald Trump was at the heart of many of the most controversial debates.
Conclusion
Beyond political cleavage, the sentiment analysis that we did might provide insights on the personalization of the political discourse, as well as a change of norms and mode of expression in the digital space towards a more aggressive stand, which is clearly shown by the downard trend of the sentiment score, however there is as mentioned uncertainties about the trajectory of the sentiment. When we look at topics, it is clear that the discourse of both parties is targetting the other and sometimes in quite an aggressive way; remember the topics like racist for the democrats and socialist for the republicans. To summarize, we showed that period of elections might be driver for political cleavage. More than just period of elections, it seems that a unique politician, Donald Trump, was the major driver for the increasing political cleavage.
However, this analysis does present some limits. First of all, our entire research is based on the idea that a sentiment score is an ideal proxy to measure the political cleavage. Further reasearch would need to be conducted to confirm that this is effectively the case. Even though the natural language processing library we chose grabs sentiment polarity in quotes, it is not perfect as it was not trained on the exact same type of sentences. Several other libraries such as TextBlob and Flair were tried as well. They either did not provide the same type of sentiment metric (Flair) or felt a bit less accurate in predicting the quotes sentiment (TextBlob), though. Furthermore, the dataset that our analysis is based on contains less quotes for 2015 and 2016, which could change our conclusions.