I have always been passionate about food and its polarity. Food can be the source of a strong and healthy life, as much as it can make you weak and sick. It can represent plain fuel for some people, or a form of artistic expression for others. It can be as simple as inserting a slice of cheese between 2 pieces of bread and as complicated as making a Michelin-star plate involving dozens of ingredients into very long and intricate processes. Having a meal is a whole experience we get so often yet can be so diverse. From getting a quick but heartwarming panini sandwich for lunch on a busy workday, to sharing a relaxed Sunday roast with one’s family.
For as long as there have been beings, food has been a vital element to promote life. It has evolved a lot across time. From choosing plants to breed in specific conditions, processes to preserve food on long periods of time, processes to make food edible or techniques to increase productivity and food supply. The current state of agriculture is the heritage of millenniums of geographical, meteorological, social, and cultural factors.
With such diverse populations and landscapes around the world, we still share many similarity in the way we make and consume food. I am wondering if it is possible to witness historical and geographical similarity with the way we eat. By clustering cuisines through their recipes, I hope to see common traits arise between cuisines from people with different ethnicity, but who share similar geographical conditions or between populations which ancestors have shared a past connection. Eventually, this approach could reveal unexpected similarities or differences between some cuisines.
To achieve this clustering effort, I have found a collection of pairs of recipe ingredients and cuisine origin. The data comes from Yummly , a recipe recommender website. The dataset contains about 40000 recipes from 20 regions. The aim is to use text processing techniques to then apply unsupervised Machine Learning techniques to find clusters of cuisines and ingredients. In the first part I will preprocess the text data, remove some stop words, and get it accessible to our following algorithms. In the second part I model the ingredients lists using 3 methods: K-Means, Principal Component Analysis (PCA) then a Latent Dirichlet Allocation (LDA) model in order to find cluster of ingredients and see if it is possible to group regional cuisines together or find regular pattern in the ingredients choice.
Table of contents
Exploratory Data Analysis
The dataset’s shape is (39774, 3). Here is a view of its first few lines:
| id | cuisine | ingredients | |
|---|---|---|---|
| 0 | 10259 | greek | [romaine lettuce, black olives, grape tomatoes... |
| 1 | 25693 | southern_us | [plain flour, ground pepper, salt, tomatoes, g... |
| 2 | 20130 | filipino | [eggs, pepper, salt, mayonnaise, cooking oil, g... |
| 3 | 22213 | indian | [water, vegetable oil, wheat, salt] |
| 4 | 13162 | indian | [black pepper, shallots, cornflour, cayenne pe... |
There are 20 different cuisines and 39 774 unique meals. The dataset came clean and so no further adjustment were needed. Here is a pie plot showing the distribution of cuisines from the dataset:
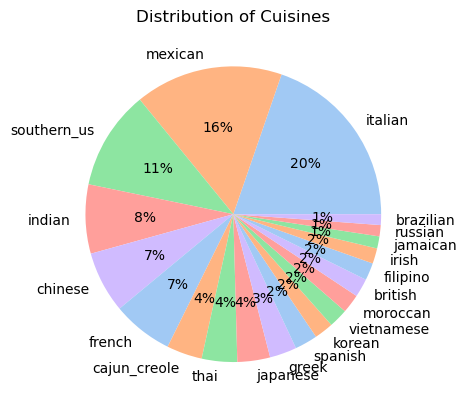
This dataset contains mostly Italian, Mexican, Southern US, Indian, Chinese and French recipes. It is not hard to guess that the data comes from an American website with such food influences.
The recipes are not equally distributed among all regions but there still are at least 467 recipes for each region.
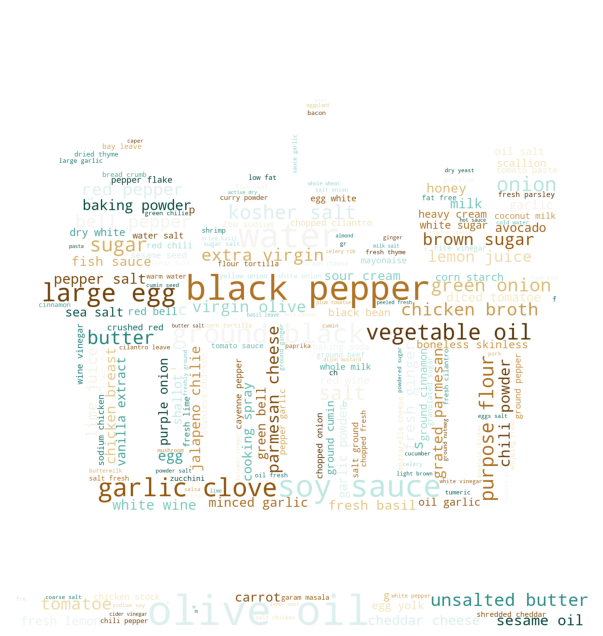
We can see that among ingredients, spices and condiments appear very often, it is expected as they are fundamental ingredients which are present in almost all recipes. We can also observe some ingredients that are symbolic of some specific cuisines: lime juice, parmesan cheese, soy sauce, jalapeno chili, green onion… These ingredients are specific to some regions and so I expect them to be markers of cuisines.
Text Processing
In this part, we will apply some text vectorizing tools so that further algorithms can use the ingredients as inputs.
Text Preprocessing
We first start by changing the lists of ingredients to a set of strings.
| id | cuisine | ingredients | ingredients_string | |
|---|---|---|---|---|
| 0 | 10259 | greek | [romaine lettuce, black olives, grape tomatoes... | romaine lettuce black olives grape tomatoes ga... |
| 1 | 25693 | southern_us | [plain flour, ground pepper, salt, tomatoes, g... | plain flour ground pepper salt tomatoes ground... |
| 2 | 20130 | filipino | [eggs, pepper, salt, mayonaise, cooking oil, g... | eggs pepper salt mayonaise cooking oil green c... |
| 3 | 22213 | indian | [water, vegetable oil, wheat, salt] | water vegetable oil wheat salt |
| 4 | 13162 | indian | [black pepper, shallots, cornflour, cayenne pe... | black pepper shallots cornflour cayenne pepper... |
We can now regroup all the ingredients present in the recipes and apply a TF-IDF algorithm to get a measure of the importance of each ingredients in the whole corpus. We can then rank the words by both IDF and TF-IDF scores.
Observation of Ingredients Frequency Ranking
Term Frequency (TF) represents how often a word appears in a document. Inverse Document Frequency (IDF) is a weight that indicates how commonly a word is used.
The more documents (recipes) it appears in, the lower the IDF score. A word with a low score means it is very common across recipes and so maybe not that important
overall.
Combined together, the TF-IDF gives us a metric to look for importance of a word across documents. The higher the TF-IDF, the more important a word probably is.
Here we observe the previously computed IDF and TF-IDF rankings of our corpus:
Features with the highest tfidf:
['piri' 'meyer' 'coconut' 'bhaji' 'peanut' 'chiles' 'spaghettini' 'bacon'
 'cho' 'nopales' 'walnuts' 'gram' 'vegetable' 'cachaca' 'seaweed' 'vodka'
 'hollandaise' 'watermelon' 'yucca' 'yuca' 'plantains' 'okra' 'cherry'
 'half' 'crab' 'almonds' 'jasmine' 'manioc' 'artichokes' 'sushi' 'fried'
 'wafer' 'duck' 'umeboshi' 'pozole' 'polenta' 'coffee' 'sticky' 'jam'
 'raspberries' 'pappadams' 'espresso' 'barley' 'peanuts' 'breadfruit'
 'butter' 'udon' 'grained' 'phyllo' 'water']


Features with the highest tfidf:
['multi' 'garland' 'teff' 'psyllium' 'cotto' 'slim' 'blueberri'
 'fruitcake' 'patties' 'romanesco' 'knoflook' 'olie' 'wok' 'gember'
 'woksaus' 'specials' 'harvest' 'hurst' 'parslei' 'moss'
 'chocolatecovered' 'vineyard' 'burgundi' 'premium' 'collect' 'pat'
 'ocean' 'sheet' 'true' 'souchong' 'ginkgo' 'serving' 'lb' 'to'
 'nonhydrogenated' 'better' 'than' 'creations' 'dijonnaise' 'loose'
 'poured' 'fondant' 'gel' 'hillshire' 'layer' 'legumes' 'sections' 'tube'
 'america' 'chilcostle']


Features with the lowest idf:
['salt' 'oil' 'pepper' 'garlic' 'ground' 'fresh' 'onions' 'sugar' 'olive'
 'sauce' 'black' 'water' 'chicken' 'cheese' 'butter' 'tomatoes' 'flour'
 'red' 'green' 'cloves' 'powder' 'onion' 'juice' 'chopped' 'eggs' 'white'
 'cilantro' 'milk' 'rice' 'vegetable' 'cream' 'ginger' 'lemon' 'corn'
 'large' 'leaves' 'vinegar' 'all' 'purpose' 'soy' 'cumin' 'broth' 'dried'
 'lime' 'wine' 'chili' 'parsley' 'bell' 'beans' 'kosher' 'carrots'
 'grated' 'extra' 'dry' 'basil' 'brown' 'unsalted' 'parmesan' 'sesame'
 'virgin' 'chilies' 'beef' 'paste' 'oregano' 'boneless' 'seeds' 'cinnamon'
 'potatoes' 'cooking' 'shredded' 'tomato' 'baking' 'thyme' 'pork' 'egg'
 'shrimp' 'fat' 'bread' 'skinless' 'yellow' 'tortillas' 'seasoning' 'low'
 'chile' 'diced' 'sodium' 'cayenne' 'breasts' 'vanilla' 'celery' 'bay'
 'coriander' 'whole' 'spray' 'leaf' 'minced' 'mushrooms' 'sour' 'crushed'
 'flakes']
Clustering
Now that the data is ready to be processed, we can group ingredients by similarity or frequency distribution. I will apply 3 algorithms: K-Means, PCA and LDA to make clusters of ingredients commonly found together.
K-means
First, I will use K-Means to cluster the ingredients. I set the number of clusters to 25, hoping to recover the 20 different cuisine types with a few added clusters for flexibility. K-Means attempts at creating clusters through elements distance measures around centroids. Running the algorithm, we obtain 25 centroids to which I show their 15 closest elements.
Top terms per cluster:
Cluster 0: chicken broth salt pepper oil garlic fresh olive sodium chopped black white ground cloves fat
Cluster 1: flour salt purpose water oil eggs sugar butter milk yeast dry vegetable large pepper olive
Cluster 2: oil olive pepper salt garlic extra virgin fresh cloves tomatoes red ground black cheese wine
Cluster 3: dried pepper garlic salt oil oregano tomatoes olive ground black cheese basil red fresh onion
Cluster 4: onions salt pepper garlic oil green water tomatoes cloves olive vegetable red chicken fresh sauce
Cluster 5: sugar water milk cream juice salt butter lemon fresh white vanilla brown orange cinnamon lime
Cluster 6: ground salt oil powder cumin garlic coriander ginger seeds chili onions leaves masala green tomatoes
Cluster 7: fresh cilantro lime salt chopped juice onion garlic oil pepper tomatoes ground chilies jalapeno cumin
Cluster 8: oil sesame sauce soy garlic rice onions ginger pepper sugar seeds salt green vinegar fresh
Cluster 9: pepper green onions chicken garlic bell salt celery sauce oil chopped rice tomatoes ground black
Cluster 10: sauce oil soy pepper chicken garlic corn starch rice ginger sugar sesame water onions salt
Cluster 11: salt cheese oil butter water fresh pepper milk garlic sauce cream juice tomatoes eggs onion
Cluster 12: fresh oil pepper salt olive lemon garlic juice chopped ground parsley black cloves cheese tomatoes
Cluster 13: chicken boneless skinless oil pepper salt garlic breasts onions breast broth fresh sauce halves cheese
Cluster 14: cheese cream shredded cheddar green tortillas onions sour beans ground chicken corn tomatoes sauce salsa
Cluster 15: pepper bell red oil salt garlic green fresh ground olive black onions tomatoes onion chopped
Cluster 16: sauce soy garlic oil sugar onions pepper salt water rice ginger vinegar chicken fresh pork
Cluster 17: fresh sauce lime fish sugar garlic oil cilantro juice rice leaves red pepper chicken coconut
Cluster 18: baking sugar flour powder salt butter purpose eggs soda large milk unsalted vanilla buttermilk extract
Cluster 19: cheese mozzarella parmesan pepper sauce garlic fresh grated salt ground ricotta shredded oil eggs pasta
Cluster 20: ground pepper salt garlic fresh oil cumin black cloves ginger cinnamon chicken coriander onions chopped
Cluster 21: cheese parmesan grated pepper salt oil garlic olive fresh butter ground black chicken cream onions
Cluster 22: powder pepper ground garlic salt cumin chili black oil onion cheese chicken corn cilantro onions
Cluster 23: pepper ground salt black oil garlic butter olive onions fresh white onion sauce flour water
Cluster 24: sugar vanilla butter large extract cream milk salt flour eggs egg purpose unsalted yolks ground
Some of these clusters seem to recover usual ingredients found in ethnic cuisines (Cluster 6: Indian, Cluster 7: Mexican, Cluster 19: Italian), sometimes several cluster seems to be linked with similar cuisine but different dishes (Clusters 7/14/22 looks more or less Mexican), and some clusters represent common meal ingredients (Cluster 24: cake ingredients, Cluster 1: condiments).
The number of clusters was set arbitrarily to get a first sense of the data. Looking at the obtained results, it may not be the appropriate choice. There is a method called the Elbow method which can help us decide what would be an approximately good amount of clusters. By checking the cumulative sum of squared distances from each cluster’s centroids, we can find a good number of clusters to fit our data.
Elbow Method
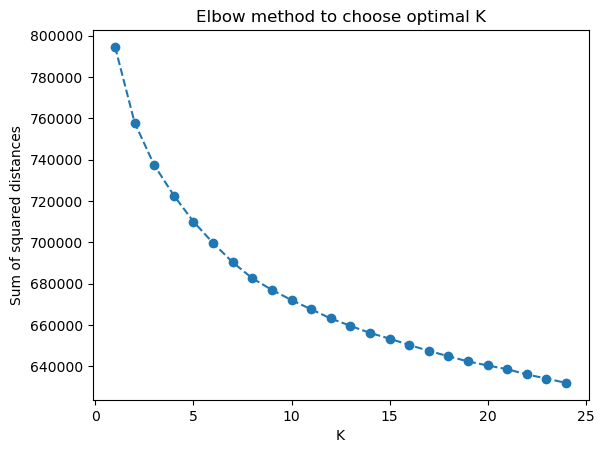
The Elbow method advises us to pick a number of clusters which is not too big but still encompasses enough dissimilarity between them. With this method, we should choose a number that sits in the angle of the curve. Here, the curve does not have a very sharp angle, I would take a value between 5 and 10 clusters.
5 Clusters
Redoing the same experiment with 5 clusters, we obtain these groups:
Top terms per cluster:
Cluster 0: sugar flour butter salt eggs purpose baking milk large vanilla powder cream extract water unsalted
Cluster 1: salt cheese pepper oil onions garlic chicken water sauce fresh cream butter ground green sugar
Cluster 2: sauce oil soy garlic pepper sugar sesame rice onions fresh ginger chicken salt green water
Cluster 3: pepper ground salt garlic oil black onions powder chicken cumin red fresh green tomatoes onion
Cluster 4: fresh oil pepper olive salt garlic cheese tomatoes cloves black ground red chopped parsley juice
There is the again the cake recipe cluster, and what I would attribute in order: a recipe for creamy chicken sauce, Asian cuisine ingredients, Mexican or Indian (southern) style meal, and Italian/Mediterranean ingredients
10 Clusters
Then, with 10 clusters:
Top terms per cluster:
Cluster 0: pepper bell red garlic salt green oil onions ground black chicken fresh tomatoes olive sauce
Cluster 1: pepper salt black ground garlic oil onions chicken butter flour water fresh onion white sauce
Cluster 2: powder salt garlic oil ground cumin chili onions cilantro tomatoes green leaves ginger pepper coriander
Cluster 3: sugar flour butter salt eggs purpose baking large vanilla milk powder extract cream unsalted water
Cluster 4: sugar salt water oil sauce fresh butter milk garlic juice onions cream chicken flour white
Cluster 5: ground pepper salt garlic oil cumin fresh black cloves chicken onions olive chopped powder ginger
Cluster 6: oil olive pepper salt garlic fresh tomatoes cheese cloves extra virgin black ground red wine
Cluster 7: fresh juice chopped oil salt pepper garlic lime cilantro lemon olive ground cloves onion chicken
Cluster 8: sauce oil soy garlic sesame sugar pepper rice onions ginger chicken salt fresh water green
Cluster 9: cheese shredded pepper cream sauce ground salt garlic chicken onions cheddar parmesan tomatoes green oil
With 10 clusters, we can see similar structure to the 5 ones. With some ingredients for bakery (cluster 3), Asian cuisine (cluster 8) Italian/Mediterranean (clusters 0,6,9) Southern/Mexican/Indian/Spicy cuisines from sunny countries (clusters 2,5,7) and casual white sauce/creamy chicken dish (clusters 1,2,4). These clusters seem to be follow the distribution of cuisine regions in the dataset, with a lot of Italian recipes (either Mediterranean ingredients like tomato, olive oil, garlic, or with the American fascination of chicken Alfredo with a creamy/buttery chicken sauce), followed by recipes from countries that are sunny and hot, where they have a lot of fresh ingredients and spices (cilantro, lime, lemon, tomatoes, garlic with various spices: coriander, cumin, chili, pepper, cloves..).
We can clearly see how these recipes come from an American community from the initial cuisine distribution and clusters that emerges from the ingredients lists. These clusters are still fairly general, having at least the 25 clusters allowed for more nuances between the big categories (difference between Mexican and Indian or Japanese and Chinese for example)
PCA
Principal Component Analysis is a popular technique to derive a set of low dimensional features from a much larger set while still preserving as much variance as possible. It is often used to do variable selection or to visualize high-dimensional data. Here we will use it for the latter purpose. We start with 3010 features which represent the total number of ingredients in our recipes and reduce it down to the 2 principal components which we’ll be able to graphically visualize.
Overview of Cuisines
Here we apply PCA on our whole dataset, keeping only the 2 principal components. This allows us to plot all the recipes according to a graph with axis representing the 2 principal components:
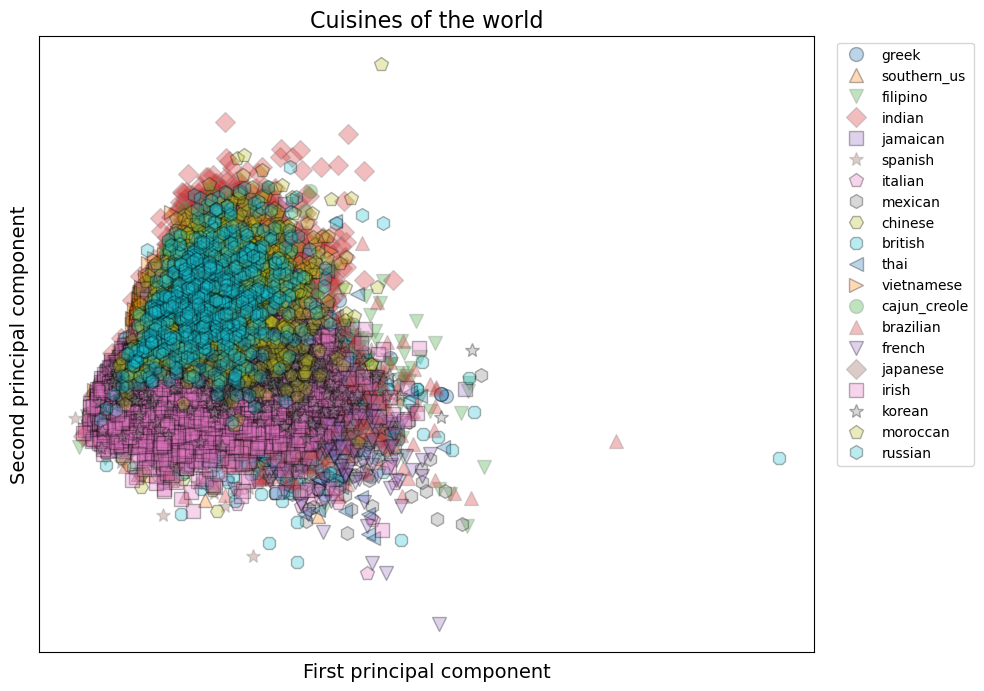
The recipes are globally well packed up, although we can see some distinct regions (pink squares at the bottom, turquoise hexagons at the top). One great thing is that, from the few clusters we can see, they seem to not have too large intra-cluster variance, we can see clear grouping of them. We could try to reduce the number of cuisines to see clearer separations.
Focus on Few Cuisines
Here I arbitrarily chose to focus on Japanese, Greek, Russian & Cajun/Creole cuisines to better observe separation between points.
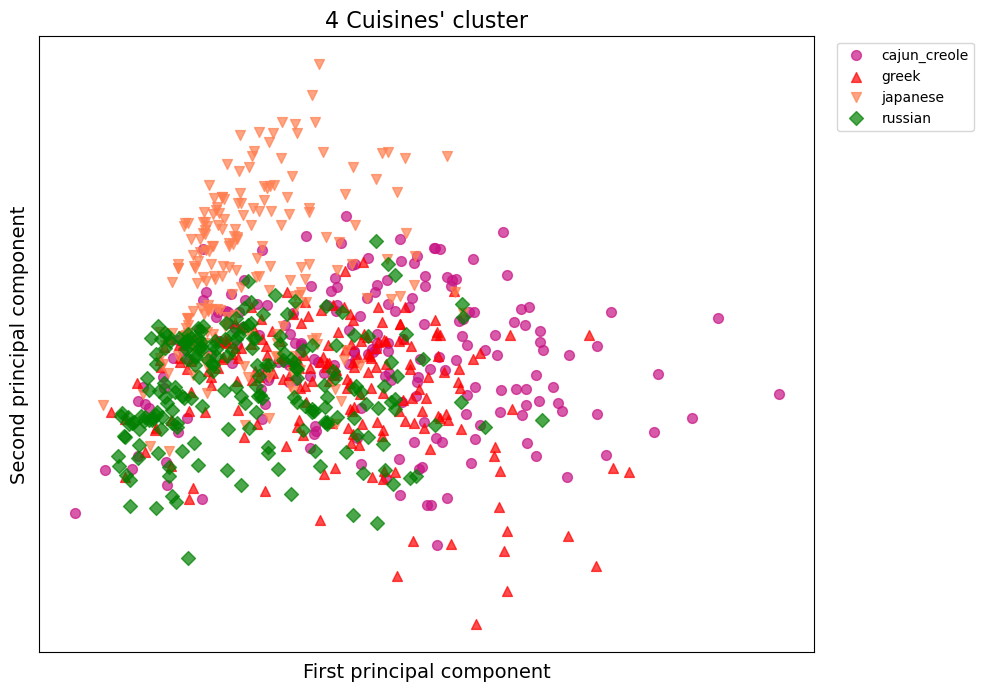
From this second graph, we can observe more distinction between the cuisines. There are still some heavy overlapping in the middle-left part of the graph, but they all seem to diverge in a different direction. Japanese cuisine tend to have a higher degree of the 2nd principal component, while Greek and Cajun/Creole have on average a higher amount of the 1st principal component.
To reduce the noise in these graphs and get another view of the resulting PCA model, we can focus on cuisine centroids, the average points of all recipes.
Centroids
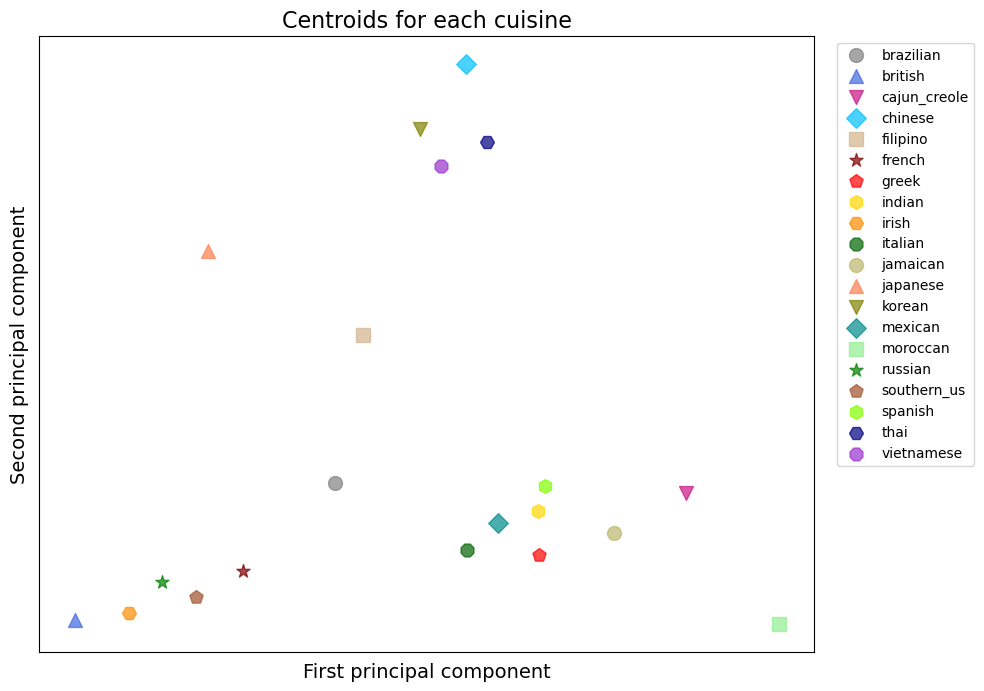
This centroid plot is much easier to read. We can see some clusters of cuisines emerging. For example, the 4 points at the very top are Chinese, Korean, Thai & Vietnamese cuisines, which are regionally very close. Japanese and Filipino cuisines are not too far from the first 4, but with each their own offset on the graph. On the bottom left we can see British, Irish, Russian, Southern_us and French cuisine making another cluster of European meals. On the bottom middle right part, another cluster is formed with Italian, Mexican, Indian, Spanish, Greek, Jamaican, Cajun/Creole, and a bit further, Moroccan cuisines. These are a mix of countries with cuisine full of spices and Mediterranean countries. A common ingredient shared by these countries could be the tomato.
Although reducing such high dimensional data to only 2 dimensions may seem extreme and lack depth in the specificity between cuisines, we can already see very logical patterns that underlines a working methodology.
Ingredients Association
Another way to look at our PCA results is to look at the way ingredients were classified among the 2 principal components. We can get these 2 values for each ingredient, plot them, then check what are the similarities between them, and the logic the model has been trying to extract.
Since there are a lot of ingredients in our corpus, we won’t be able to plot them all. To get ingredients with various polarity, I will just extract several elements with the highest and lowest values for each of the 2 principal components.
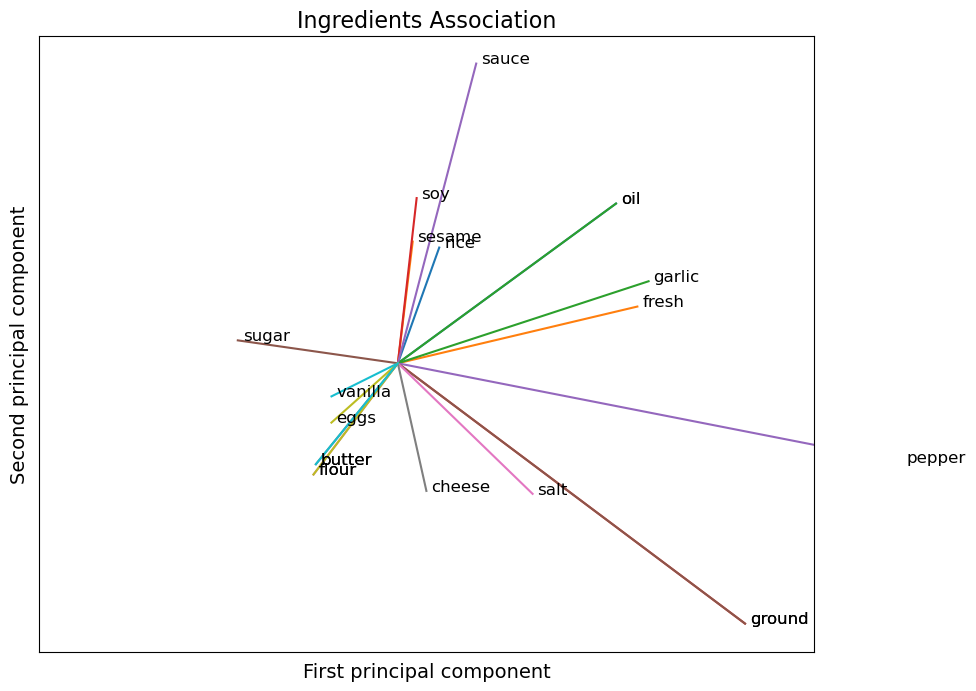
This graph shows the vectorized position of the ingredients among the 2 principal components of the model. Again, we can see some groups of ingredients that share really similar attributes. Soy, sesame, rice, sauce, oil, garlic, fresh on the top right corner are all ingredients commonly found in Asian cuisine. While on the bottom left side: flour, butter, eggs, vanilla & sugar are very common pastry ingredients.
It is interesting to see how just 2 variables can capture so much information about a very large number of various ingredients.
Our simple 2 dimensional PCA model has been working great. However, we don’t know how much it really captured overall nuances. We can check this with the explained variance ratio which is a ratio of the variance a model with K components can keep compared to one with all of its components.
Cumulative Explained Variance
Here I plot the cumulative explained variance for all k combination of principal components.
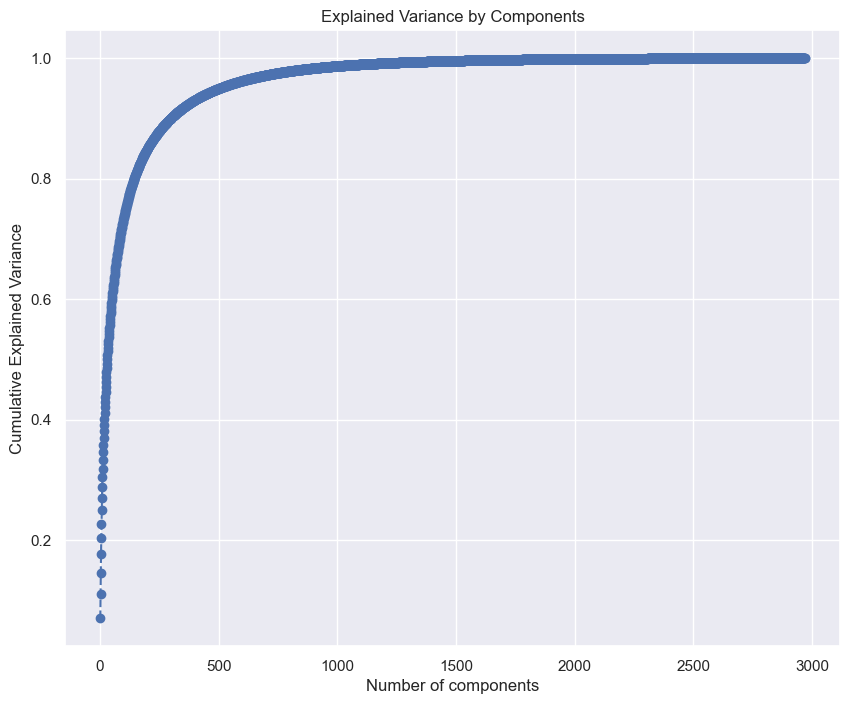
This curve represent the amount of variance a PCA with k components would contain. We can see a very sharp curve, increasing very fast on the first few several hundreds of components, before curving horizontally. This means that a model that would have 500 principal components would contain almost 95% of the variance coming from all ingredients. Unfortunately, we can see that a model with just 2 principal components does not carry a majority of the total variance.
Variance ratio of the first 2 principal components: 11.08%
Our model with 2 principal components captures only 11% of total variance, yet it still manages to understand a lot of similarity between ingredients and cuisines.
Here are the number of components that would be needed, with our current dataset, to carry more overall variance:
Initial number of features (ingredients):  3010
Number of Principle Components to keep 50% of data variance:  29
Number of Principle Components to keep 80% of data variance:  143
Number of Principle Components to keep 90% of data variance:  297
Number of Principle Components to keep 95% of data variance:  502
Number of Principle Components to keep 99% of data variance:  1112
LDA
LDA is used to discover latent (hidden) topics within data thanks to Dirichlet distributions. There are 2 Dirichlet distributions used in LDA, one over the topics (here, ideally the cuisine) in each document and another over the words (ingredients) in each topic. Contrary to PCA and other algorithms that use distance measures to determine similarity, LDA is based on the frequency counts of words within topics. Here I extract the top 25 topics (clusters) using the LDA algorithm:
topic 0       topic 1       topic 2       topic 3       topic 4       topic 5       topic 6       topic 7       topic 8
--------      --------      --------      --------      --------      --------      --------      --------      --------
pork          pepper        dried         ground        cheese        sesame        cheese        sugar         chicken
pepper        red           oregano       pepper        cream         oil           fresh         egg           boneless
ground        vinegar       tomato        salt          sour          sauce         parmesan      cream         skinless
salt          oil           garlic        cumin         shredded      soy           oil           vanilla       breasts
garlic        olive         pepper        garlic        tortillas     rice          olive         milk          breast
sauce         salt          tomatoes      fresh         cheddar       seeds         pepper        extract       halves
vinegar       wine          paste         oil           green         sugar         grated        large         broth
black         onion         ground        paprika       corn          onions        garlic        butter        pepper
beef          fresh         salt          cayenne       beans         vinegar       basil         yolks         oil
sugar         black         thyme         black         onions        garlic        salt          chocolate     thighs


topic 9       topic 10      topic 11      topic 12      topic 13      topic 14      topic 15      topic 16      topic 17
--------      --------      --------      --------      --------      --------      --------      --------      --------
water         olive         fresh         fresh         seeds         mustard       sauce         fat           lemon
flour         extra         lime          wine          salt          butter        oil           cooking       juice
dry           oil           juice         parsley       powder        meat          soy           low           fresh
salt          virgin        mint          white         oil           bread         garlic        sodium        orange
bread         salt          cilantro      leaf          coriander     dijon         ginger        spray         zest
oil           garlic        leaves        dry           cumin         sea           pepper        broth         grated
yeast         cloves        fish          salt          ginger        mayonaise     starch        chicken       peel
purpose       pepper        sugar         oil           onions        apples        corn          reduced       apple
crumbs        tomatoes      sauce         chopped       chili         fine          onions        free          sugar
warm          fresh         chopped       butter        seed          eggs          sesame        chopped       dill


topic 18      topic 19      topic 20      topic 21      topic 22      topic 23      topic 24
--------      --------      --------      --------      --------      --------      --------
salt          yogurt        flour         cheese        cilantro      pepper        coconut
butter        plain         purpose       mozzarella    salt          bell          milk
pepper        greek         baking        sauce         lime          green         sauce
cheese        nonfat        salt          italian       fresh         onions        red
ground        style         eggs          shredded      garlic        garlic        fish
eggs          mixed         sugar         parmesan      onion         salt          lime
potatoes      vegetables    butter        ricotta       chilies       red           paste
cream         mango         powder        pasta         oil           sauce         curry
milk          milk          milk          seasoning     pepper        oil           rice
black         free          large         eggs          chopped       rice          oil
Again, we can see similar groups of ingredients to previous results. There are regional clusters (0: Eastern Asia, 2: Mediterranean, 4: Mexican, 5: Japanese, 14: French…). Although it looks like this algorithm got a different understanding, with more categories of food. There are groups of ingredients by category (1: Condiments, 3: Spices, 17: Citrus/Fresh fruits and herbs, 16,19: healthy ingredients…) and common recipes (7,20: Cakes, 9: Breads). It seems like LDA captured better the role of some ingredients rather than their relative occurrence in recipes like previously. It may be due to the fact that LDA and K-Means use spatial distance as a measure of similarity whereas LDA use term occurrence and so it found ingredients that appear in similar context rather than words that appear together often.
Conclusion
Thanks to the various techniques employed here, I managed to extract simple similarity measures between various cuisines and ingredients association. We can see how the models captured similarity between geographically close places (Thai, Chinese, Korean, Vietnam on one side, Spanish, Mexican, Indian on the other..) and ingredient types (condiments, citrus, baking staples).
The dataset I used is not really optimal for this task as it feels very influenced by American cooking and habits. I see several big biases that should be accounted for in a further analysis, to extract clearer insights:
- Get a more equal distribution of recipes
- Have the recipes written by locals or taken from locals/chefs with more precise ingredients choices (From experience and looking at the data, I know people often cut corners when doing international dishes (using lemon instead of limes, curry powder instead of specific set of spices, white wine instead of mirin etc.) which is fine in practice, but which creates biases for this kind of task)
- keep n-gram of words as some ingredients share same component (ground black pepper VS bell pepper)