This project is a sales insight on a mock data set from a hardware company. Here, we try to analyze the sales revenue and profit evolution in various regions of India and for different customers over several years.
Summary
- Overview of the Data and Challenges
- Analysis
Overview of the Data and challenges
Dataset
We have a dataset from Haardaveyar, a company which supplies computer hardware and peripherals to many clients in India.
The dataset contains 5 tables: customers, date, markets, products and transactions
Here is a small description of each of them:
- customers: it contains the identifier of the customers, their names, and a categorical value being either 'Brick & Mortar' or 'E-Commerce'
- date: it contains several declinations of the date. The whole date and its 3 granularity (date, month, year), and a cy date column representing the 1st of each month for business purposes.
- markets: it contains the unique market identifiers with their associated name and a zone column, the location in the country
- products: it contains the identifiers for each products. For each of them there is a category 'Own Brand' or 'Distribution' associated
- transactions: 10 columns that recap the whole information of each transaction, from the customer, market and product IDs, to the sales amount, profit and cost
Business needs
Our client is the head of the sales team. He would like to get a dashboard to have an overview of the current state of his company's sales. He wants to know in which market/product/customer he should invest time and money.
Interpretation and research questions
From our understanding, the client wants a dashboard that can display the company's overall income while still being able to observe the performance of its market, customer and product
at a unit level. The dashboard should include various graphs and resources on an aggregated level with some charts that shows individual contribution.
In this context, investment rhymes with performance. Thus, the dashboard should be able to answer the following questions:
- Which markets are the most profitable ?
- Which markets have been the most stable source of income ?
- Which markets have been performing well recently ?
- Which markets have been performing bad recently ?
Exploratory Data Analysis and Cleaning
The head of sales provided us 5 tables, let's take a closer look at each of them.
Customers
SELECT *
FROM customers
| customer_code | custmer_name | customer_type |
| Cus001 | Surge Stores | Brick & Mortar |
| Cus002 | Nomad Stores | Brick & Mortar |
| ... | ||
| Cus037 | Propel | E-Commerce |
| Cus038 | Leader | E-Commerce |
SELECT c.customer_type AS Customer_type,
	count(c.customer_type) AS Nb_customer
FROM customers c
GROUP BY c.customer_type
| Customer_type | Nb_customer |
| Brick & Mortar | 19 |
| E-commerce | 19 |
There are 38 customers, out of which half sell through internet and the other half in local stores.
Date
SELECT *
FROM date
| date | cy_date | year | month_name | date_yy_mmm | |||||
| 2017-06-01 | 2017-06-01 | 2017 | June | 17-Jun | |||||
| 2017-06-02 | 2017-06-01 | 2017 | June | 17-Jun | |||||
| ... | |||||||||
| 2020-06-30 | 2020-06-01 | 2020 | June | 20-Jun |
| First_date | Last_date |
| 2017-06-01 | 2020-06-30 |
Our dataset contains 3 years of transactions, made between June 2017 and June 2020.
Markets
SELECT *
FROM markets
| markets_code | markets_name | zone |
| Mark001 | Chennai | South |
| Mark002 | Mumbai | Central |
| Mark015 | Bhubaneshwar | South |
| Mark097 | New York | |
| Mark999 | Paris |
The last 2 rows of this table does not show any zone. Our dataset is supposed to showcase sales which occured in India, so there should be neither Paris, nor New York. We can check if there are any transactions that involved one of these cities.
SELECT *
FROM transactions t
WHERE t.market_code = 'Mark097' or t.market_code = 'Mark999'
| product_code | customer_code | market_code | order_date | sales_qty | sales_amount | currency |
There is no transaction involving any of these 2 cities. Therefore, we can safely remove them from our dataset.
SELECT m.zone AS Zone,
	count(m.zone) AS Zone_count,
FROM markets m
FROM Zone_count  DESC
| Zone | Zone_count |
| North | 6 |
| South | 5 |
| Central | 4 |
There are 15 market regions divided in 3 zones, with markets located mostly in North, then South then in the central area of India.
Products
SELECT *
FROM products
| product_code | product_type |
| Prod001 | Own Brand |
| ... | ... |
| Prod279 | Distribution |
SELECT p.product_type AS Product_type,
	count(p.product_type) AS Count_product_type
FROM products p
GROUP BY Product_type
| Product_type | Count_product_type |
| Own Brand | 191 |
| Distribution | 88 |
There are 279 products, out of which about 2/3 are of Own Brand type, and the remaining 1/3 are Distribution products.
Transactions
SELECT *
FROM transactions
| product_code | customer_code | market_code | order_date | sales_qty | sales_amount | currency |
| Prod001 | Cus001 | Mark001 | 2017-10-10 | 100 | 41241 | INR |
| Prod001 | Cus002 | Mark002 | 2018-05-08 | 3 | -1 | INR |
| ... | ||||||
| Prod018 | Cus022 | Mark002 | 2019-02-18 | 3 | 6125 | INR |
| Prod018 | Cus025 | Mark002 | 2019-02-18 | 8 | 17495 | INR |
SELECT count(*) AS Nb_transactions
FROM transactions
| Nb_transactions |
| 150283 |
Here we have more than 150000 transactions. As we can see in the transactions table, there is a row that contain a -1. This should not happen as one should not be able to buy a produce of negative price.
SELECT distinct(t.sales_amount) AS Distinct_sales_amount
FROM transactions t
ORDER BY Distinct_sales_amount ASC
| Distinct_sales_amount |
| -1 |
| 0 |
| 5 |
| 9 |
| 14 |
| ... |
As we can see, there are amounts of 0 and -1. This should not happen, these transactions will be removed.
SELECT distinct(t.sales_qty) AS Distinct_sales_qty
FROM transactions t
ORDER BY Distinct_sales_qty ASC
| Distinct_sales_amount |
| 1 |
| 2 |
| 3 |
| ... |
The issue does not arise for sales quantity.
SELECT *
FROM transactions t
WHERE t.sales_amount = 0 OR t.sales_amount = -1
ORDER BY t.sales_amount ASC
| product_code | customer_code | market_code | order_date | sales_qty | sales_amount | currency |
| Prod001 | Cus002 | Mark002 | 2018-05-08 | 3 | -1 | INR |
| Prod001 | Cus002 | Mark002 | 2018-05-08 | 3 | -1 | INR |
| Prod010 | Cus015 | Mark006 | 2018-05-26 | 1 | 0 | INR |
| ... | ||||||
| Prod265 | Cus029 | Mark011 | 2018-12-11 | 1 | 0 | INR |
There are 2 transactions of value -1. It is actually a duplicate of the same transaction. The remaining transactions with value 0 could either be some kind of mistake from an employee, a gift, or any kind of error in registering the transaction. As we don't have more information on this, I will remove them all.
SELECT count(*) AS Nb_outliers
FROM transactions t
WHERE t.sales_amount = 0 OR t.sales_amount = -1
| Nb_outliers |
| 1611 |
SELECT t.currency AS Currency,
	count(t.currency) AS Count_currency
FROM transactions t
GROUP BY Currency
| Currency | Count_currency |
| INR | 148393 |
| USD | 2 |
SELECT *
FROM transactions t
WHERE t.currency = 'USD'
| product_code | customer_code | market_code | order_date | sales_qty | sales_amount | currency | profit_margin_percentage | profit_margin | cost_price |
| Prod003 | Cus005 | Mark004 | 2017-11-20 | 59 | 500 | USD | 0.31 | 11625 | 25875 |
| Prod003 | Cus005 | Mark004 | 2017-11-22 | 36 | 250 | USD | 0.17 | 3187.5 | 15562.5 |
In this case, since there are only 2 transactions that have been done in USD, we can either treat it as an outlier, compared to the huge amount of transactions made in Indian Rupees, and remove it. Or we can just change the currency at the transaction date's exchange rate and keep the record. In this case, I kept the record.
Analysis
Key Performance Indicator
To satisfy our customer's needs, we need measures that efficiently express the performance evolution of the different markets, customers and products sales. To do so, we will create 3 performance indicators: the Revenue, the Profit Margin Percentage, and the Average Percentage of Profit. These indicator will help us establish which product, market or customer are the most profitable at an individual and overall scale.
Revenue
The Revenue consists of the raw total income, which is the sum of the sales_amount. This variable is important as it illustrates the weight a market or customer represent for our client. It can also show which product are staples for the consumers and source of stability for our client.
Here is the DAX formula to create the variable in Power BI:
Revenue =
SUM ( 'sales transactions'[sales_amount] )
Average Profit Margin %
The Average Profit Margin % is the percentage of profit among the total revenue on average. This indicator displays how profitable an item is. High profits transactions can arise from various factors that should be investigated (new product, few or no opponent on the market..). This metric is very valuable as profits are what makes the company run. Products and markets with high profits should be closely looked at, as a source of income and leverage for our client.
Here is the DAX formula to create the variable in Power BI:
Profit Margin % =
DIVIDE (
    SUM ( 'sales transactions'[profit_margin] ),
    SUM ( 'sales transactions'[sales_amount] ),
    0
)
Profit Margin Contribution %
The Profit Margin Contribution % is the relative profit of a given market, producer, or customer, across all the others. As a representation of the share of profit accross all other terms, this metric exhibits which markets, products or customers are the most profitable to our client.
Here is the DAX formula to create the variable in Power BI:
Profit Margin Contribution % =
DIVIDE (
    [Total Profit Margin],
    CALCULATE (
        SUM ( 'sales transactions'[profit_margin] ),
        ALL ( 'sales products' ),
        ALL ( 'sales customers' ),
        ALL ( 'sales markets' )
    )
)
Dashboard
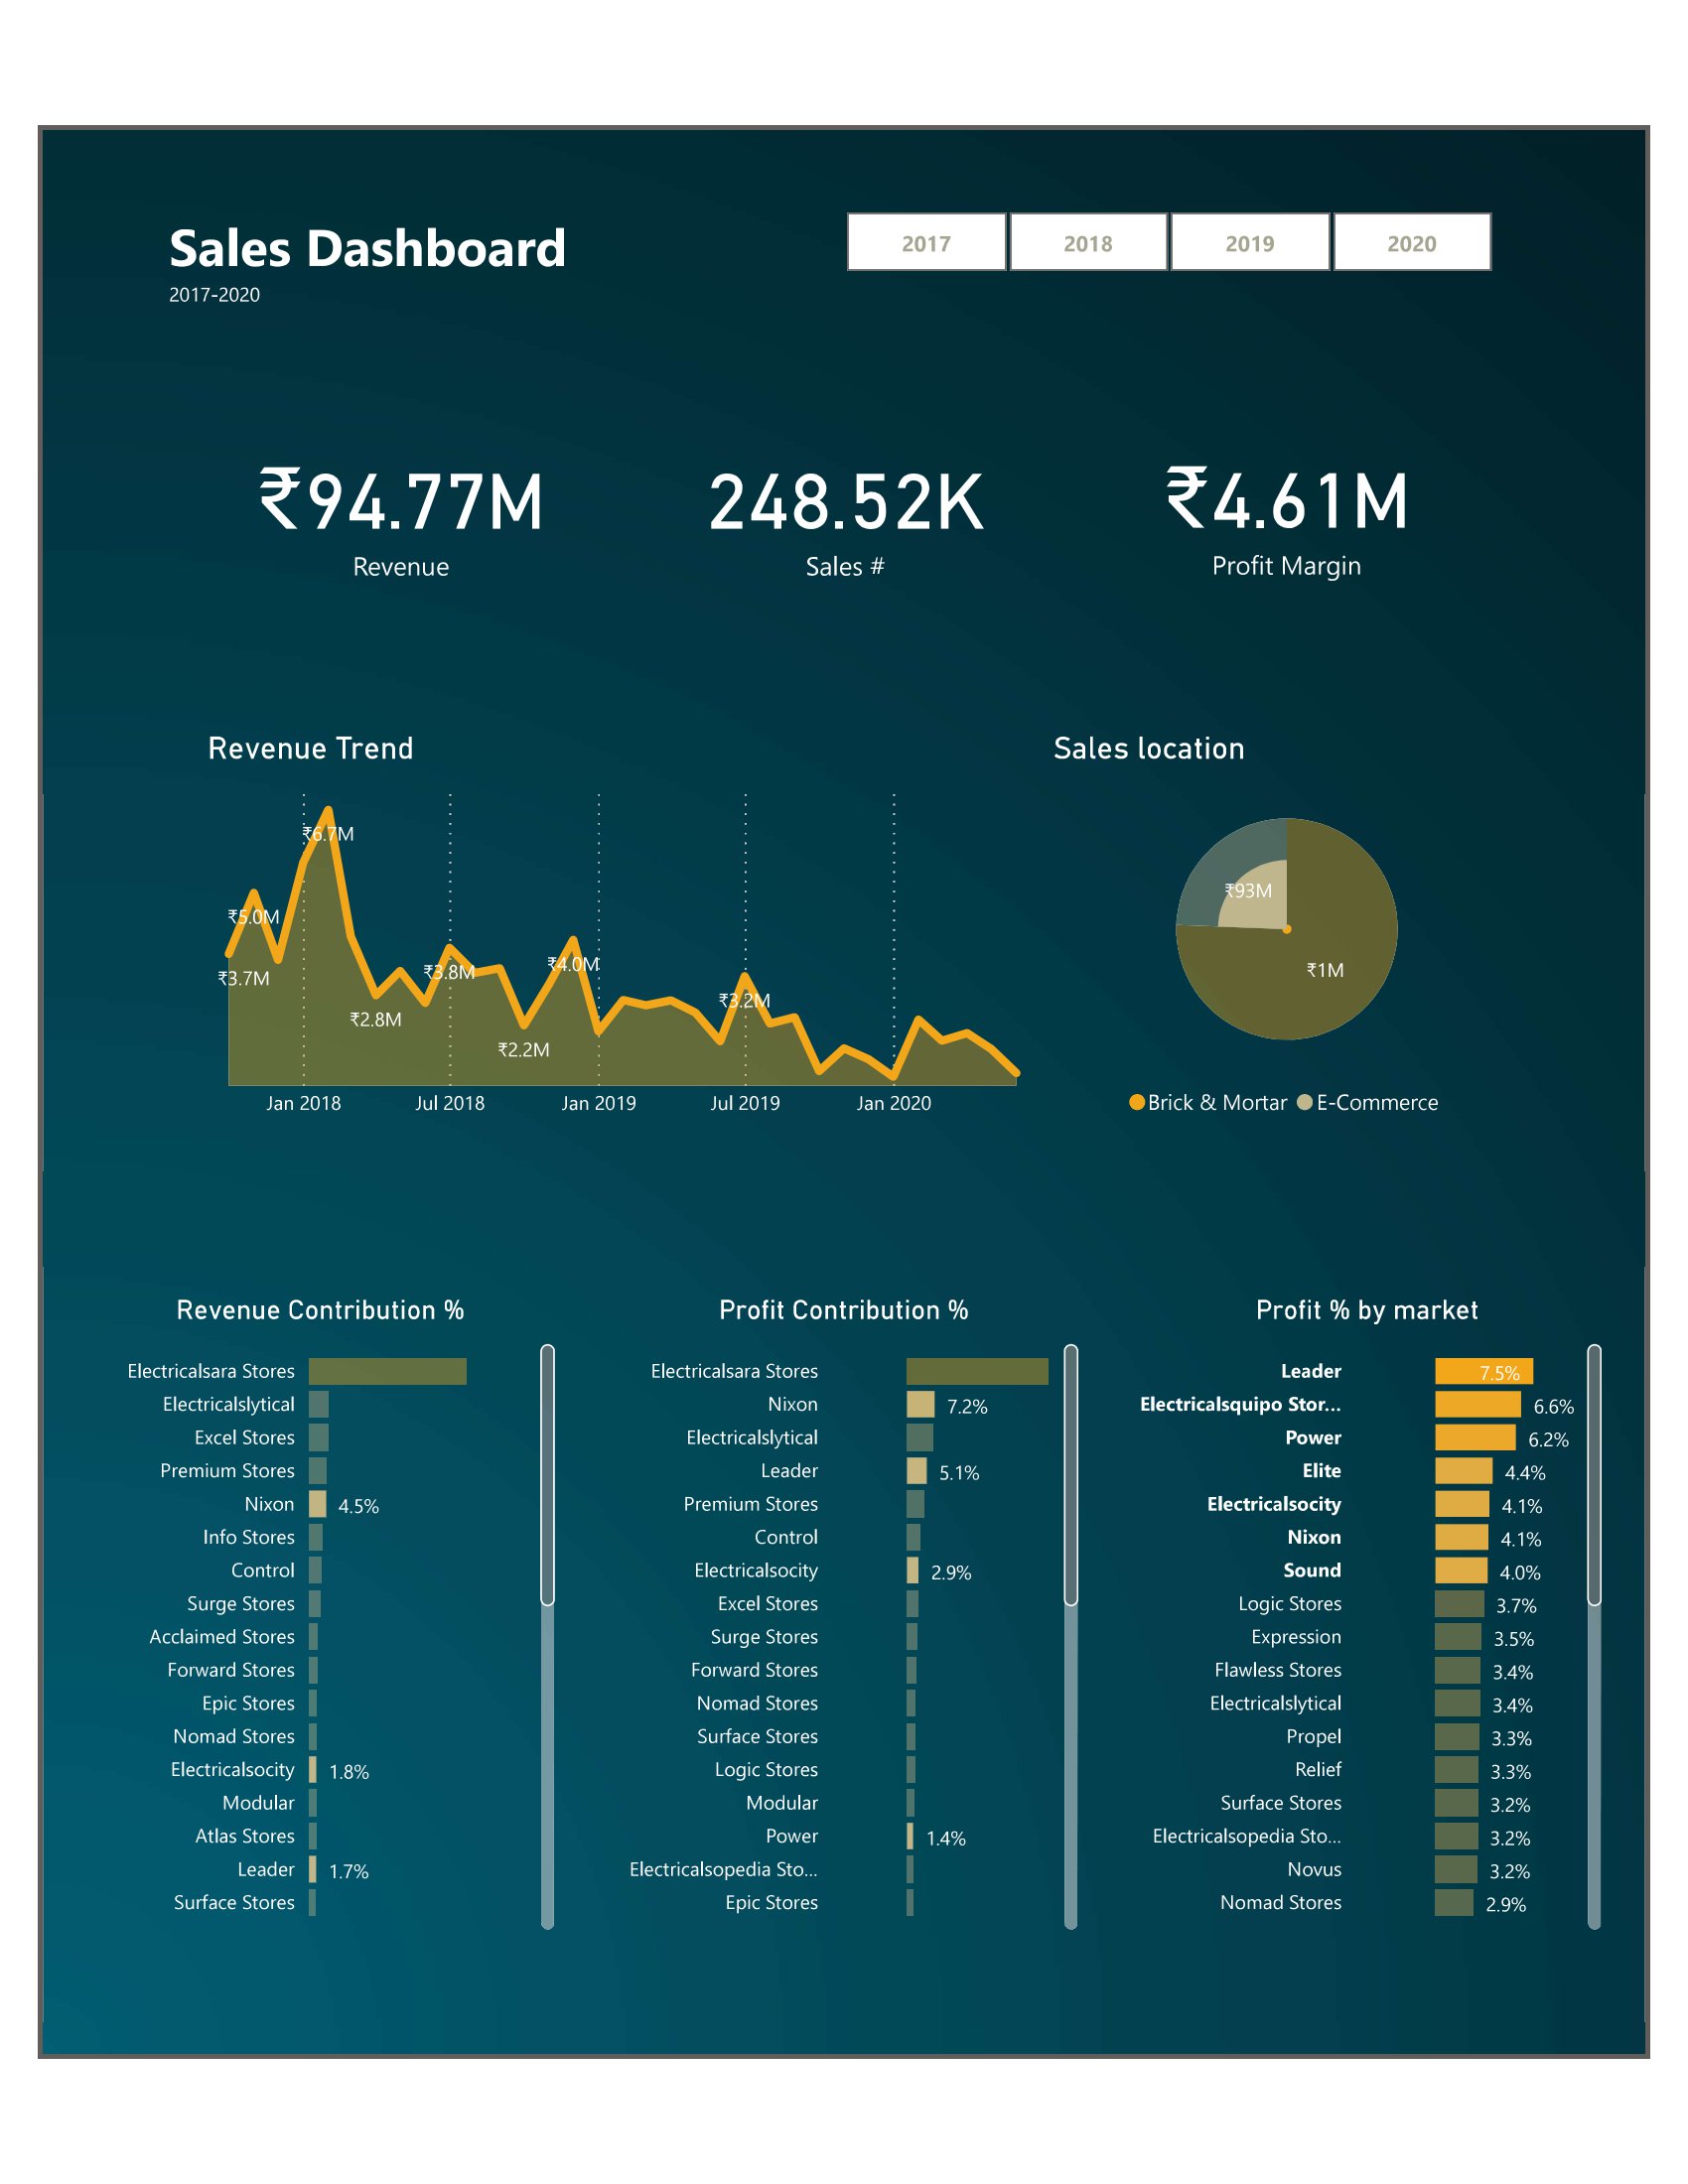
Using Power BI, I was able to create the following dashboard. It displays our 3 KPIs in various plots. We can change the granularity at many different levels: year, sales type or the market contributor. This first dashboard shows the overall trend and accomplishment over the 4 years of focus.
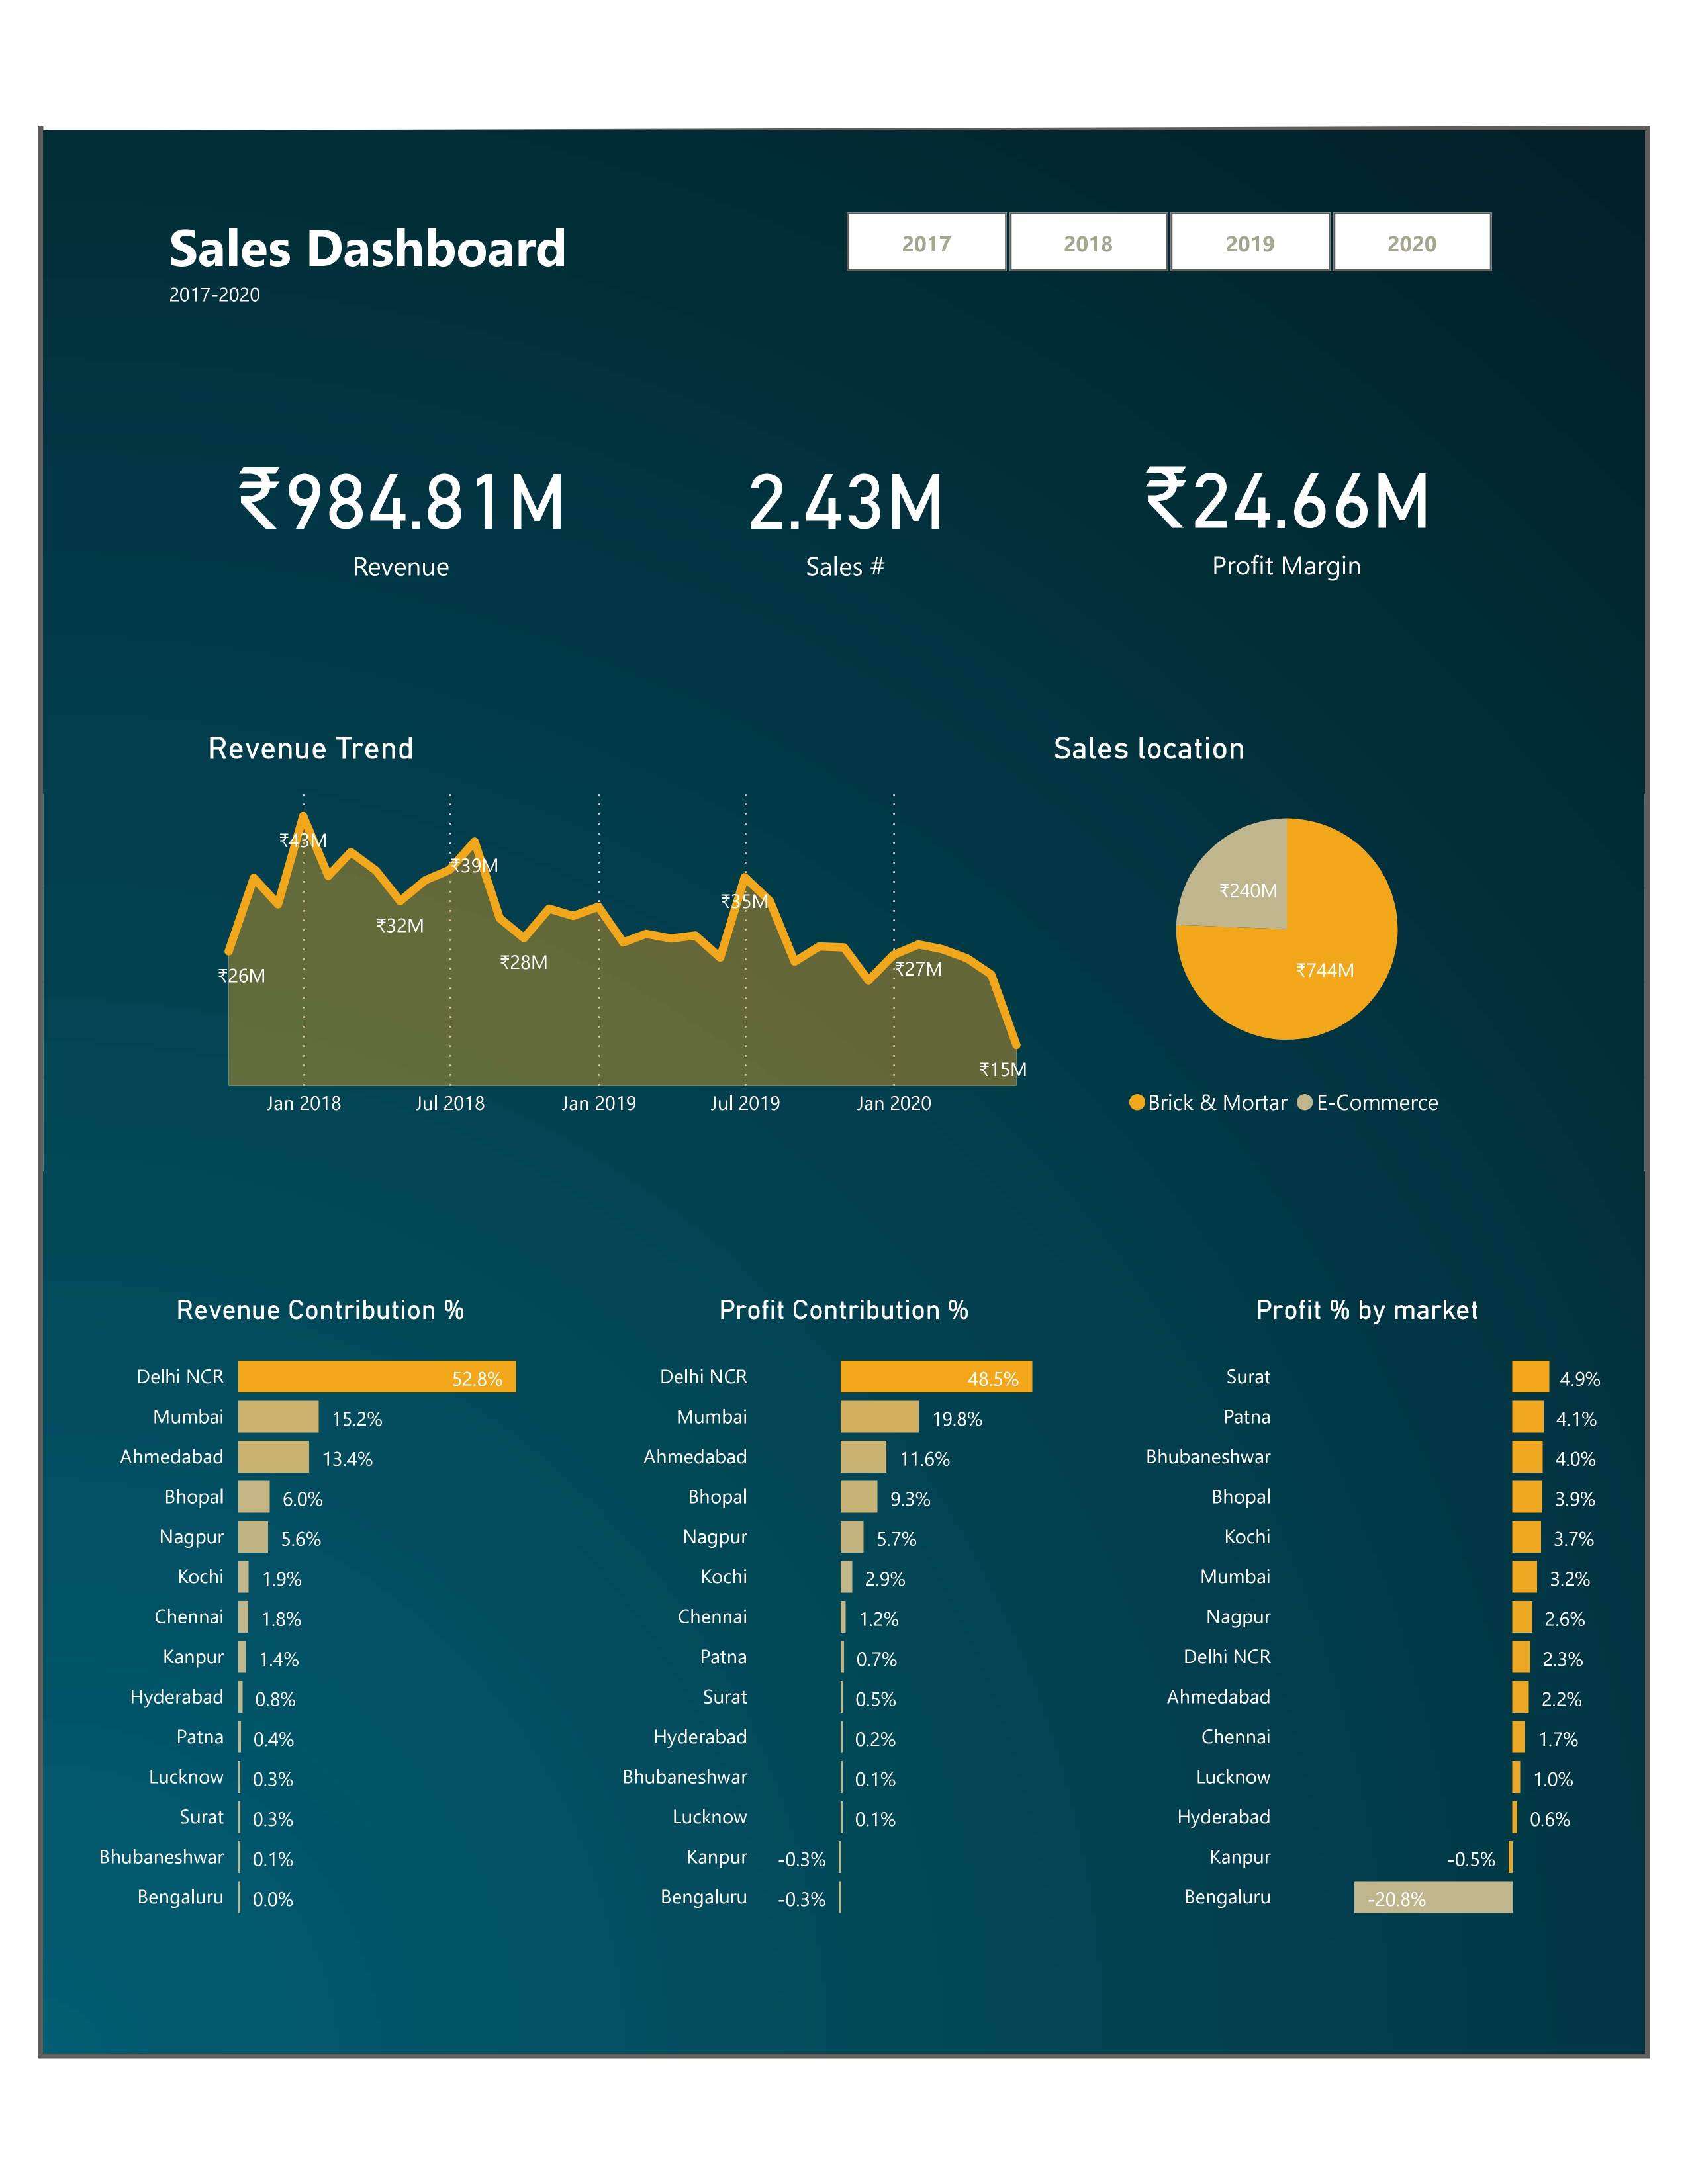
This first version of the dashboard showcases simple overall statistics: the total revenue, total profit, and total number of sales on the first line. The middle part of the board presents the revenue trend over the 4 years, with a pie chart illustrating the amount of e-commerce vs local brick & mortar sales. Finally, the bar charts at the bottom show the contribution of each market in the dataset through the revenue and profits KPIs. The bar charts can be changed to display the contribution at a customer and product level as well.
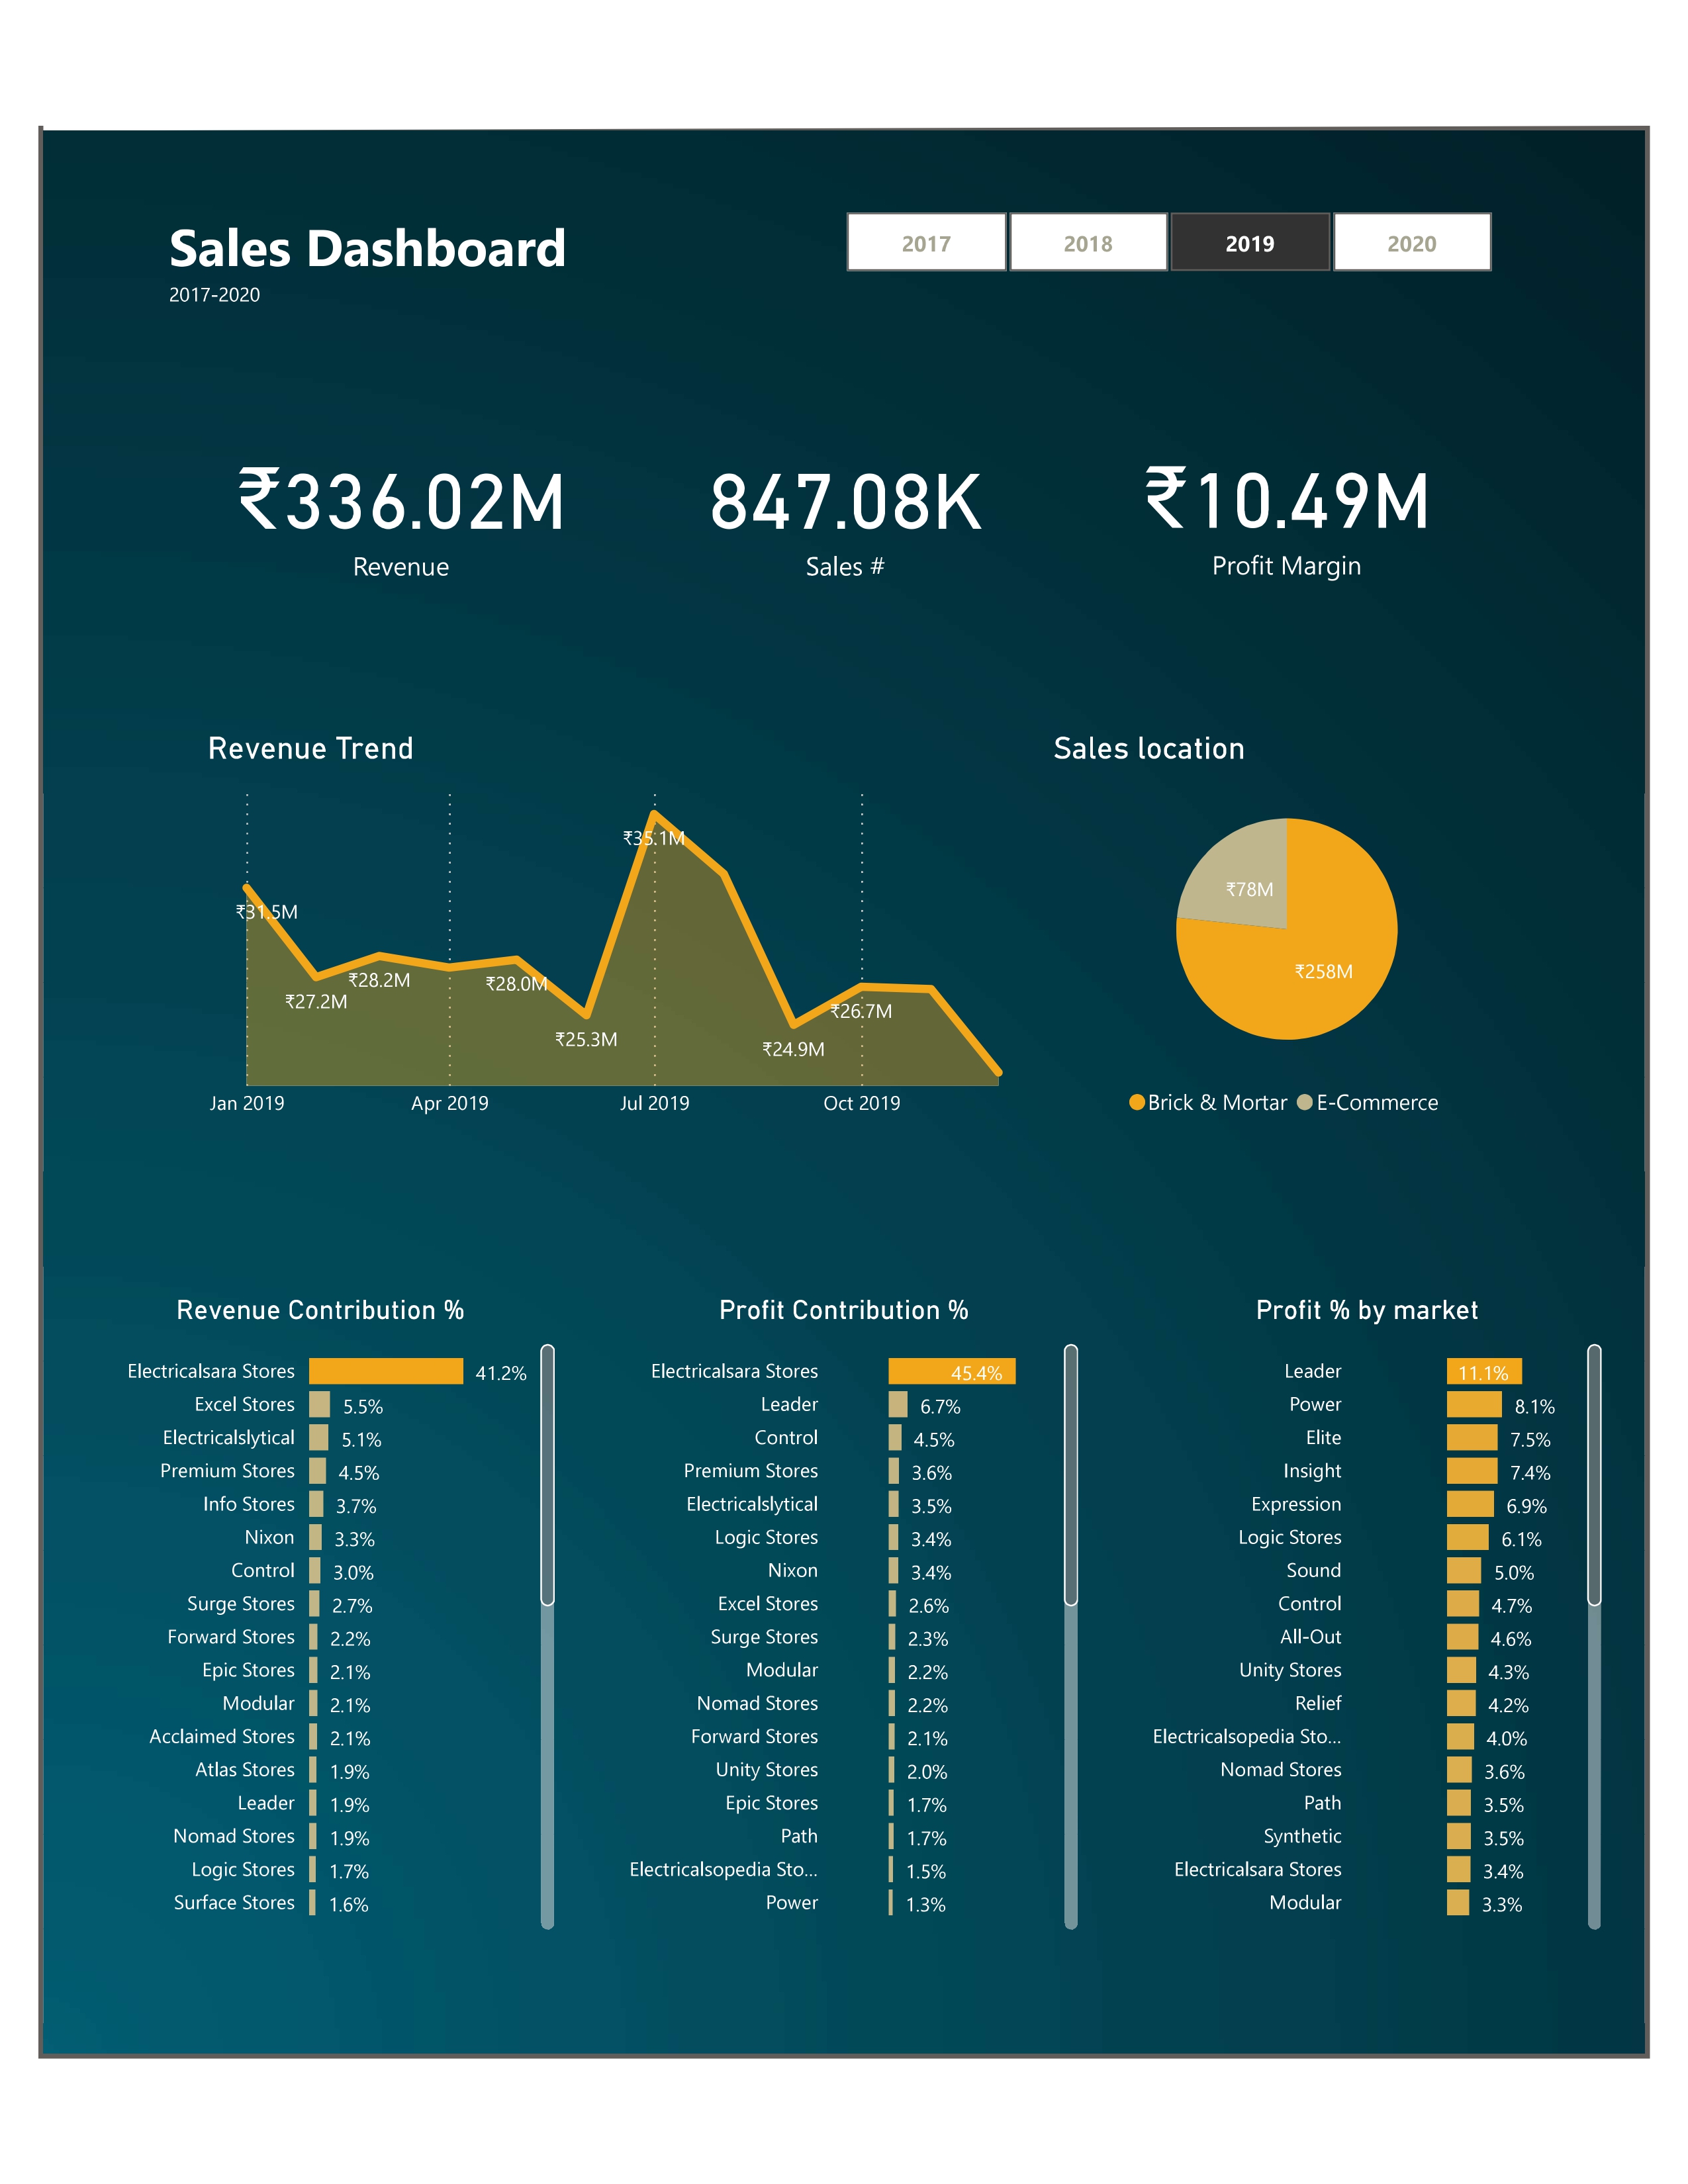
This second figure shows the relative income of the customers in 2019. We can see that Electricalsara Stores is one of the most important customer given the revenue and profits our client generates from them. Looking at the top customers in each bar charts allows us to draw deeper insights.
Thanks to the various variations of the dashboard, we can get really interesting insights on our client's sales.
On the first figure, we can see the importance of the Electricalsara Stores as the main source of Revenue and Profit of his company. Although, we can see through the third bar
chart that the average profit % is quite low, meaning that the hardware company generates overall a good amount of money over a huge number of transactions with very low profits.
The second figure shows that the following 5 customers who contribute to the revenue the highest have various shares of contribution towards global profit. We can see that Nixon and
Electricalslytical are 2 very great customers with which their company makes a significant number of transactions with fairly high profits.
The third figure on the right, shows which markets make the most profit out of each transactions. Since this is a relative number, top customers in this category present various
impacts on revenue. Again, Nixon is present in all top parts of the charts. Leader and Electricalsocity are also customers that bring consequent revenue and profit.
Business Insights
Here are some high-level insights I would give my client with the appropriate dashboard illustrations:
Note: to showcase the performance, I added the individual KPI as such:
[% Revenue contribution/% Profit contribution/% Avg Profit per transaction]
Overall
- From 2017 to 2019, Electricalsara Stores have been the main contributors to the overall profit of my client's company. Indeed, these stores have been contributing to more than a 3rd of the overall profit each year. This is their main client with which they are the most profitable and which generate them the most revenue. A small dip in mid 2020 could be investigated.
-
New Delhi, Mumbai, Ahmedabad, Bhopal and Nagpur have always been the same top 5 markets in both revenue and overall profit contribution (5%-50%). These are
the strongest markets.
Kochi, Chennai, Patna and Surat are the main follow-up with non-negligible profit contribution (0.5%-3%) and relatively high average profit per transaction (1.7%-4.9%). Except for Surat, these markets have been showing great performance in early 2020 with very high profits both at an overall contribution and average transaction levels. These performance should be encouraged. - Apart from Electricalsara Stores which are full Brick & Mortar, customers relying on E-commerce have been yielding our client's company the most profitable transactions. These highly profitable transactions gives their company leverage to be taken advantage of (investing in more ads, promotions..)
Main customer: Electricalsara Stores 
Markets
E-commerce status
2019: previous year performance
- Leader [1.9/6.7/11.1], Control [3/4.5/4.7] and Logic Stores [1.7/3.4/6.1] all had high average profit per transaction in 2019. Each of these stores managed to have a transaction average profit of over 4.5%. These customers have been very profitable last year, keeping a good relationship with them is advised.
Customers: Leader, Control, Logic Stores
2020: current trend
- In the beginning of 2020, products 083 [0.6/9.8/25.7], 070 [0.5/7.6/22.7], 206 [0.5/7.7/21] and 308 [1.5/14.8/14.2] have been the star products. With a combined profit contribution of 39.9% despite their 3.1% cumulated revenue, and individual average profit of > 14% per transactions, these products have been selling very well. Understanding why is key to strategize on how to take advantage of these.
- These products have had a higher share of the revenue (0.7%-1.2%) in the beginning of 2020, but with a lesser profit contribution (4.9%-6.4%) and profit per transaction (6%-12.7%), except for product 324 [3.5/7.9/3.3] which has high profit and revenue contribution rates but with a lower profit per transaction of 3.3%. These products have had very great performance in this first half of the year, so I put them in this second, yet very good, tier as products to investigate.
- The Hyderabad market has had a rough start in 2017 [1/-1/-3.1], keeping low profile in 2018 [0.6/0.4/1.5], before deeping down again in 2019 [0.8/-0.4/-1.5] but have risen back up in early 2020 [0.8/3.9/6.7], with a record 0.55M in revenue in March. This sudden outbreak should be investigated
Tier A products: 083, 070, 206, 308
Tier B products: 324, 159, 313, 332, 201, 318
Market: Hyderabad
Final remarks
This dashboard is a simple yet informative version of Haardaveyar company sales state. It displays revenue and profit metrics, sales trend and the top markets, customers or
products at any given time. It is a highly flexible dashboard, prone to change depending on the needs and questions at hand.